The dotnet-trace command line tool is a rather neat piece of technology: by taking advantage of the .NET runtime’s EventPipe component, it is able to collect tracing data in a way that is both consistent and agnostic to the underlying operating system.
It gets even better though: you can start and stop collecting traces without having to restart the target application! This makes it a particularly useful tool for analysing performance issues in long-running containerized .NET applications, a common need in companies that run their workloads in Kubernetes clusters.
Critical Manufacturing is an example of such a company: our MES1 runs on OpenShift (an enterprise Kubernetes offering) and the host of the MES, in many ways the heart of this system, is an ASP.NET Core application running in a Kubernetes pod. So, the question lends itself: can dotnet-trace be used to collect tracing data in a live MES host? The answer is yes… with an asterisk.
The asterisk Link to heading
Collecting the tracing data is relatively straightforward: you simply copy the dotnet-trace executable to the pod with the .NET application, collect the tracing data, and then copy the trace file to your computer. All that remains to do now is figuring out why service xyz took 5 seconds to execute by analysing the traces with your favourite trace analysis tool. dotnet-trace supports 3 different trace formats, but I’d recommend that you use the Chromium format alongside the Perfetto trace viewer to analyse your .NET traces.
I’ve done the steps in the paragraph above several times, and in almost every single trace file I found something like this:
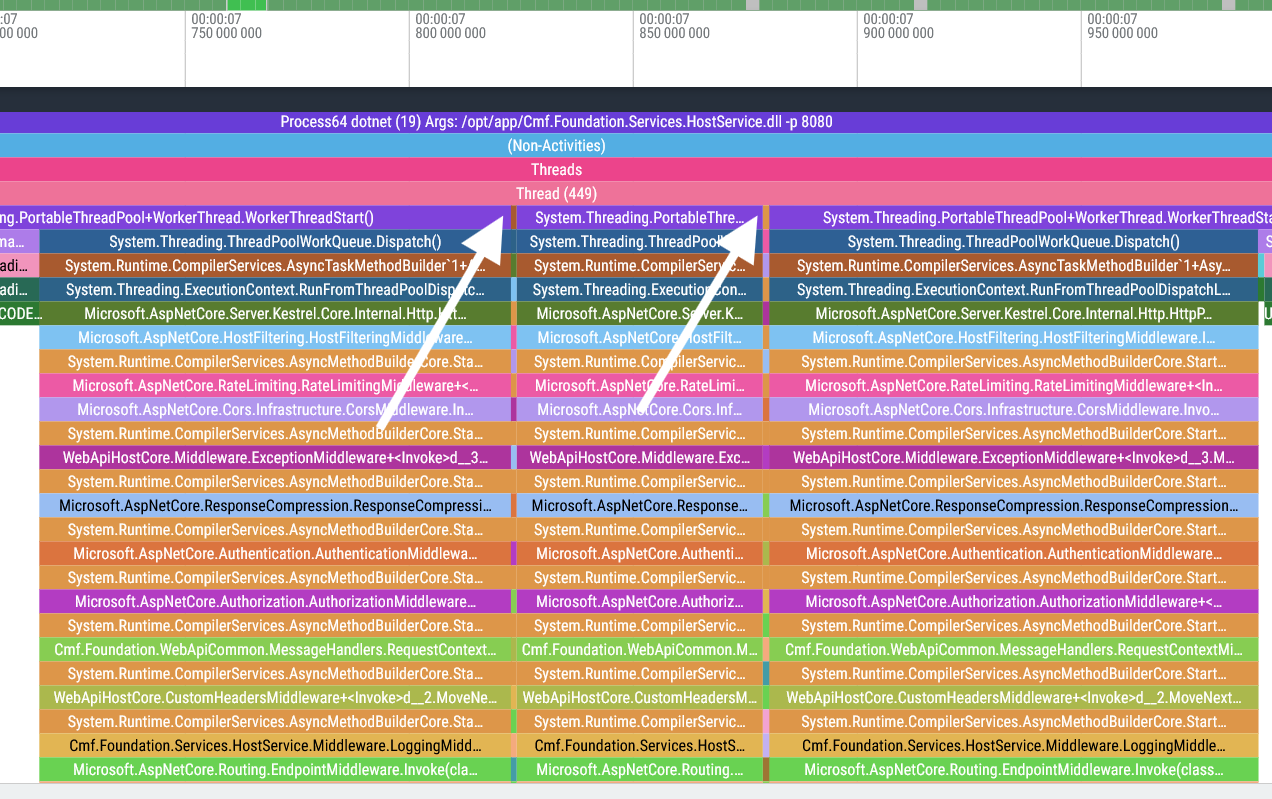
These two discontinuities indicated by the arrows cause what was meant to be a singular span to be broken into 3 separate spans. What are these spikes2 doing here? When we zoom in on one of these discontinuities, things get even weirder:
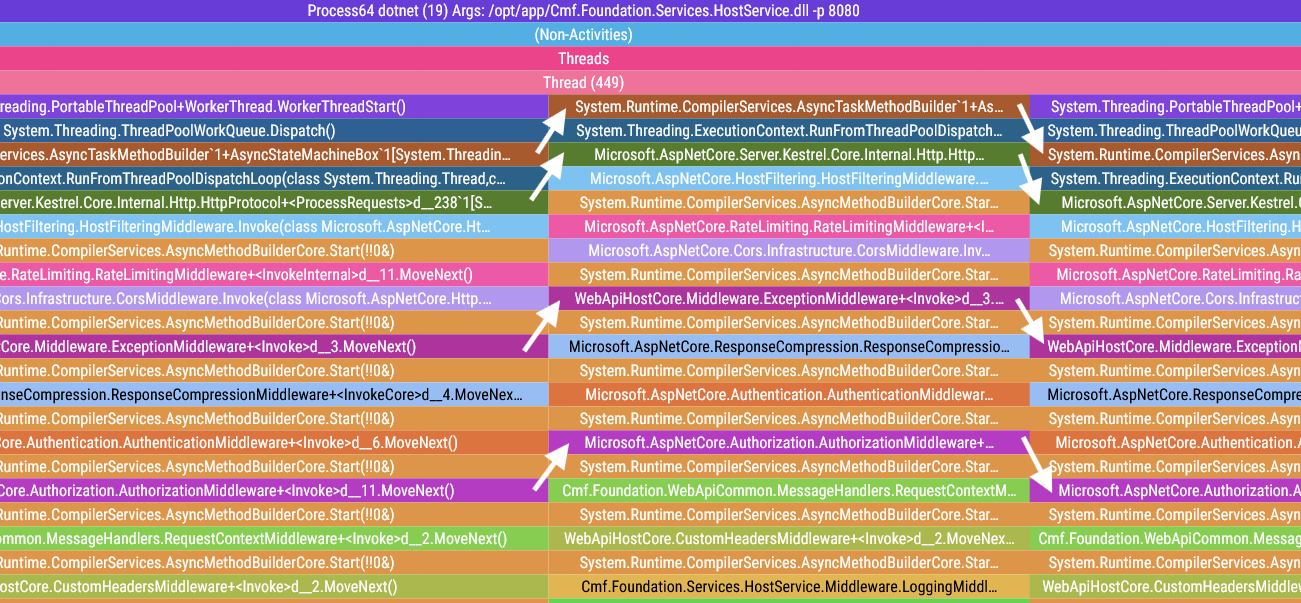
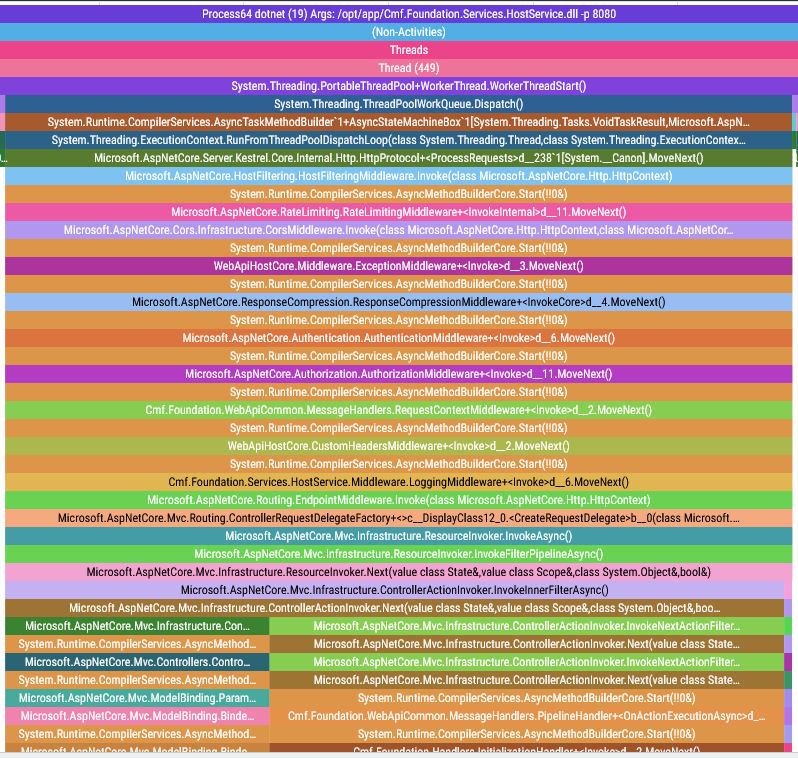
The call stack of the spike is nearly identical to what comes before and after, but for some reason the first two base function calls are missing, which pushes the spike two frames up. Looking at the tail of the call stack of these spikes will give us the final piece of the puzzle:
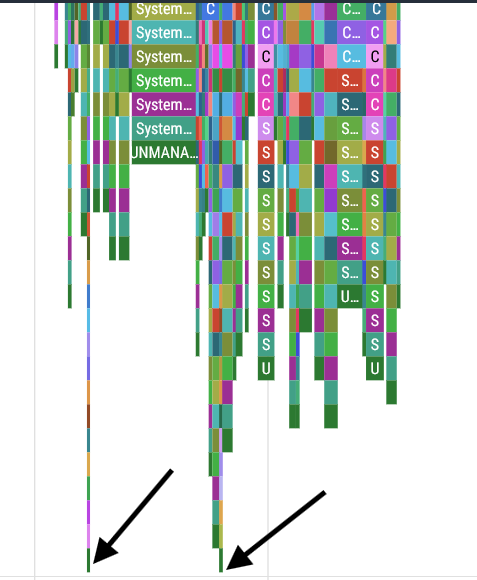
The two spikes have the exact same height… that can’t be a coincidence. Let’s check the height of these spikes: it’s exactly 100 stack frames tall. What’s going on here?!
The .NET EventPipe’s 100 stack frame limit Link to heading
It turns out that I’m not the only person with this issue. After some digging, I found this github issue detailing the exact same problem with dotnet-trace, and after some back and forth they managed to figure out where the problem lies:
Hi @JaneySprings, thank you for providing that sample. The timeframes where it seemed like base events were being omitted had deeper call stacks to the neighbors where the base events were not omitted. From offline discussion with @noahfalk, he had a suspicion that the max stack depth of 100 led to base events being trimmed in favor of newer events.
After bumping that stack depth to 1000, from the speedscopes I’ve obtained, it looks like the max stack depth of 100 is the cause for base events being omitted.
So it looks like the EventPipe component has a hardcoded limit of 100 stack frames, and if this limit is exceeded the base stack frames are truncated: this is the cause of the misalignments we saw in our trace viewer. A quick look at the EventPipe’s source code confirms the existence of this limit:
#define EP_ACTIVITY_ID_SIZE EP_GUID_SIZE
#define EP_MAX_STACK_DEPTH 100 // <---------- BINGO!!

/* EventPipe Enums. */
typedef enum {
    EP_BUFFER_STATE_WRITABLE = 0,
    EP_BUFFER_STATE_READ_ONLY = 1
} EventPipeBufferState;
// Author's note: this code snippet has been edited for improved readability
So, where does this leave us? We can’t fix this issue by changing the EP_MAX_STACK_DEPTH as that would require rebuilding and running a custom version of the .NET runtime. But even if we could do it, why would we want to take the performance hit of raising this limit? We can fix this in post by manipulating the trace data: as long as we can detect the spikes and add the missing base stack frames, we can make these discontinuities disappear. All it takes is a little surgery on the trace file.
Performing surgery on the trace file Link to heading
Before diving head-first into editing Chromium trace files, maybe we should understand what we’re getting ourselves into first.
The Chromium trace format: a primer Link to heading
The Chromium trace files generated by dotnet-trace are JSON files with a couple of properties, but the only one that really matters is traceEvents: a list of trace events that indicate either the start or the end of a function span. These events have 7 properties:
- name: The name of the function span
- cat: String with a list of comma-separated categories
- ph: Event type. We only care about two: Begin (
B) and End (E). As you might expect, each Begin event will have its matching End event - ts: Timestamp in microseconds
- pid: Process ID
- tid: Thread ID
- sf: Stack frame ID, which references a specific stack frame in the auxiliary
stackFramesdictionary
"traceEvents": [
    {
        "name": "Process64 dotnet (19) Args: /opt/app/Cmf.Foundation.Services.HostService.dll -p 8080",
        "cat": "sampleEvent",
        "ph": "B",
        "ts": 580.102,
        "pid": 0,
        "tid": 19,
        "sf": 0
    },
    {"name": "(Non-Activities)", "cat": "sampleEvent", "ph": "B", "ts": 580.102, "pid": 0, "tid": 19, "sf": 1},
    {"name": "Threads",          "cat": "sampleEvent", "ph": "B", "ts": 580.102, "pid": 0, "tid": 19, "sf": 2},
    {"name": "Thread (19)",      "cat": "sampleEvent", "ph": "B", "ts": 580.102, "pid": 0, "tid": 19, "sf": 3},
    ...
Large trace files can easily have hundreds of thousands of these events! For more information on this trace file format, please go check this document.
Detecting spikes Link to heading
dotnet-trace is a sampling profiler. This means that when we get a spike, we get a list of 100 stack frames all with the exact same timestamp because they were captured in the same sampling event. This technical detail makes finding spikes in our trace file quite straightforward:
def find_discontinuities(trace_events : List[Dict[str, Any]]) -> List[int]:
    """Finds all sequences of 100 "Begin" trace events that share the same timestamp

    Returns:
        List[int]: List of indices that point to the start of discontinuities
            or "spikes" in the list of trace events
    """
    res = []

    candidate = None
    for index, event in enumerate(trace_events):
        if (event["ph"]) == "E":
            candidate = None

        elif candidate == None:
            candidate = (index, event["ts"])

        elif index - candidate[0] == 100:
            # We found a spike!
            res.append(candidate[0])
            candidate = None

        elif candidate[1] != event["ts"]:
            # If the timestamp doesn't match, reset the candidate
            candidate = (index, event["ts"])

    return res
Running this function on our trace file identifies the following discontinuities in our trace file:
Index: 10456, Thread: 409, Timestamp: 12.2s, Name: Microsoft.AspNetCore.RateLimiting.RateLimitingMiddleware+<InvokeInternal>d__11.MoveNext()
Index: 44076, Thread: 449, Timestamp: 7.82s, Name: System.Runtime.CompilerServices.AsyncTaskMethodBuilder`1+AsyncStateMachineBox`1[System.Threading.Tasks.VoidTaskResult,Microsoft.AspNetCore.Server.Kestrel.Core.Internal.Http.HttpProtocol+<ProcessRequests>d__238`1[System.__Canon]].MoveNext(class System.Threading.Thread)
Index: 44824, Thread: 449, Timestamp: 7.88s, Name: System.Runtime.CompilerServices.AsyncMethodBuilderCore.Start(!!0&)
Index: 55108, Thread: 450, Timestamp: 6.91s, Name: System.Threading.ThreadPoolWorkQueue.Dispatch()
Index: 62258, Thread: 450, Timestamp: 11.73s, Name: Microsoft.AspNetCore.Server.Kestrel.Core.Internal.Http.HttpProtocol+<ProcessRequests>d__238`1[System.__Canon].MoveNext()
Index: 62764, Thread: 450, Timestamp: 11.74s, Name: WebApiHostCore.Middleware.ExceptionMiddleware+<Invoke>d__3.MoveNext()
Index: 69034, Thread: 450, Timestamp: 14.67s, Name: System.Threading.ExecutionContext.RunFromThreadPoolDispatchLoop(class System.Threading.Thread,class System.Threading.ExecutionContext,class System.Threading.ContextCallback,class System.Object)
The second and third lines might be familiar to you: they’re the two spikes that led us down this rabbit hole!
Adding the missing stack frames Link to heading
This is the tricky bit. Now that we have located our spikes, we need to do the following:
- Determine which stack frames are missing in the spike
- Insert the missing trace events in our
traceEventslist (easier said than done) - Do this without screwing up our list of indices that point to the spikes
Determine the missing stack frames Link to heading
Much like the problem of programatically finding spikes, this is a tricky issue that can be addressed with simple code by taking advantage of some key technical details.
In order for the stack frames of the spike to show up correctly, the stack frames of the correct trace have to be closed immediately before the stack frames of the spike open. This leads to the rather convenient observation that the missing stack frames appear as E trace events right next to the beginning of the spike! With a closer inspection of the events of the trace file, this becomes obvious:
# Notice how the name of this stack frame matches the name
# of the stack frame that is the base of the spike.
#
# This means that the two stack frames in the middle
# are the missing stack frames.
{
    "name": "System.Runtime.CompilerServices.AsyncTaskMethodBuilder`1+AsyncStateMachineBox`1[System.Threading.Tasks.VoidTaskResult,Microsoft.AspNetCore.Server.Kestrel.Core.Internal.Http.HttpProtocol+\u003cProcessRequests\u003ed__238`1[System.__Canon]].MoveNext(class System.Threading.Thread)",
    "ph": "E",
},
{   # Missing stack frame 7823421.551037414
    "name": "System.Threading.ThreadPoolWorkQueue.Dispatch()",
    "ph": "E",
},
{   # Missing stack frame
    "name": "System.Threading.PortableThreadPool+WorkerThread.WorkerThreadStart()",
    "ph": "E",
},
{   # Beginning of the spike
    "name": "System.Runtime.CompilerServices.AsyncTaskMethodBuilder`1+AsyncStateMachineBox`1[System.Threading.Tasks.VoidTaskResult,Microsoft.AspNetCore.Server.Kestrel.Core.Internal.Http.HttpProtocol+\u003cProcessRequests\u003ed__238`1[System.__Canon]].MoveNext(class System.Threading.Thread)",
    "ph": "B",
},
# Excerpt from the trace file's "traceEvents" property. Some fields were omitted for brevity
Now that we know how easy it is to get this information, getting the list of missing stack frames becomes a formality:
def get_missing_stack_frames(index : int, trace_events : List[Dict[str, Any]]) -> List[str]:
    """Returns the missing stack frames for a given spike

    Returns:
        List[str]: A list of the missing stack frame names
    """
    spike_base_name = trace_events[index]["name"]
    res = []

    while True:
        index -= 1
        current_name = trace_events[index]["name"]

        if current_name == spike_base_name:
            return res
        else:
            res.append(current_name)
Insert the missing stack frames in the spikes Link to heading
In order to inject the missing stack frames in our spikes we need to “wrap” the events of the spike with some trace events of our own making. I know this is hard to visualize, so I came up with this little diagram to help you get a better feel of what the end goal is:
Before:             After:
(fn0 and fn1
are missing)        B fn0,
                    B fn1,
B fn2,              B fn2,
B fn3,  -------->   B fn3,
E fn3,              E fn3,
E fn2,              E fn2,
                    E fn1,
                    E fn0,
So, we need to add the missing B (Begin) trace events before the first spike trace event, and the missing E (End) trace events after the final spike trace event.
def add_missing_stack_frames_to_spike(spike_pointer : int, trace_events : List[Dict[str, Any]]) -> int:
    """Adds the missing stack frames to the spike pointed by spike_pointer.

    Returns:
        int: The number of added trace events
    """
    end_index = find_matching_trace_event(spike_pointer, trace_events)

    begin_ts = trace_events[spike_pointer]["ts"]
    end_ts   = trace_events[end_index]["ts"]

    pid = trace_events[spike_pointer]["pid"]
    tid = trace_events[spike_pointer]["tid"]

    stack_frames = get_missing_stack_frames(spike_pointer, trace_events)

    # Add the Begin trace events
    for name in reversed(stack_frames):
        trace_events.insert(spike_pointer, {
            "name" : name,
            "ph" : "B",
            "ts" : begin_ts,
            "pid" : pid,
            "tid" : tid,
        })
    end_index += len(stack_frames) # Update the end index to reflect the newly added events

    # Add the End trace events
    for name in reversed(stack_frames):
        trace_events.insert(end_index + 1, {
            "name" : name,
            "ph" : "E",
            "ts" : end_ts,
            "pid" : pid,
            "tid" : tid,
        })
        end_index += 1 # Update the end index

    return len(stack_frames) * 2
The trace events being created are missing the cat and sf properties. There is a good reason for this, which will become clear down the line.
In order to easily find the matching E event for any given B trace event, I wrote this auxiliary function:
def find_matching_trace_event(index : int, trace_events : List[Dict[str, Any]]) -> int:
    """Finds the matching trace event.

    Returns:
        int: A pointer to the matching trace event
    """
    depth = 0

    while True:
        index += 1

        if trace_events[index]["ph"] == "B":
            depth += 1
        else:
            depth -= 1

        if depth == 0:
            return index + 1
And don’t forget about keeping the indices up to date! Link to heading
Oops, almost forgot! Calling add_missing_stack_frames_to_spike() leads to new trace events being added to the traceEvents list, which means any indices pointing to this list need to be corrected to account for this growth.
In essence, when you call add_missing_stack_frames_to_spike() you must update the spike pointers immediately:
def fix_spikes(trace_file: Dict[str, Any]):
    "Fix the spikes/discontinuities in the trace file"

    # These pointers are guaranteed to be ordered from lowest to highest
    spike_pointers = find_discontinuities(trace_file["traceEvents"])

    for i in range(len(spike_pointers)):
        offset = add_missing_stack_frames_to_spike(spike_pointers[i], trace_file["traceEvents"])

        # Update the necessary spike pointers
        for j in range(i + 1, len(spike_pointers)):
            spike_pointers[j] += offset
After all this work, where does this leave us? Let’s see:
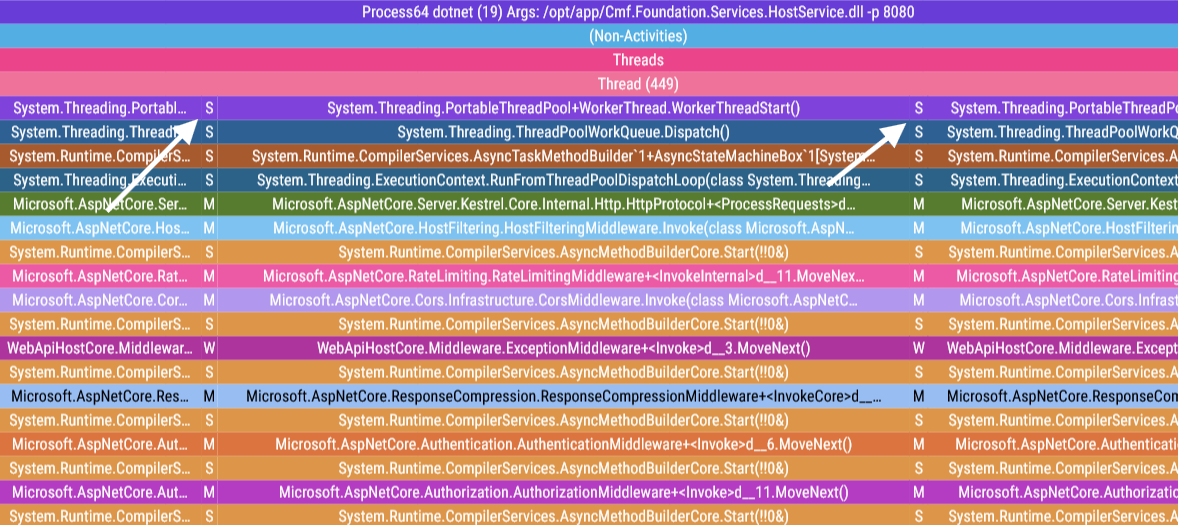
The spikes are no longer offset to their neighboring spans! All that remains to be done is turn these 5 spans into a single unified span.
Stitching together the function spans Link to heading
Merging spans together is a matter of deleting (E, B) trace event pairings that sit together in the traceEvents list and share the same name, pid, tid, and timestamp.3
Please note that this means that the trace events created in the previous chapter will be removed by the code below! That’s why I didn’t bother with replicating every single field when crafting these artificial trace events: their presence in the trace file would always be merely temporary.
def merge_spans(trace_events : List[Dict[str, Any]]):
    "Merge contiguous spans that share the same name, tid, pid, and timestamp."
    index = 1
    while index < len(trace_events):
        current  = trace_events[index]
        previous = trace_events[index - 1]

        event_types_are_correct = (previous["ph"], current["ph"]) == ("E", "B")
        same_name = current["name"] == previous["name"]
        same_tid  = current["tid"]  == previous["tid"]
        same_pid  = current["pid"]  == previous["pid"]
        timestamps_match = current["ts"] - previous["ts"] < 50 # Within 50 us

        if event_types_are_correct and same_name and same_tid and same_pid and timestamps_match:
            trace_events.pop(index - 1)
            trace_events.pop(index - 1)
            index -= 1
        else:
            index += 1

def fix_spikes(trace_file: Dict[str, Any]):
    ...
    merge_spans(trace_file["traceEvents"])
It’s time to take a final look at our traces:
Et voilà! As if by magic, our spikes disappear and we now have perfectly flush function spans. But you and I both know there’s no magic here: just a lot of very careful manipulation of trace events underpinned by our understanding of how these trace events are laid out in the trace file.
Final notes Link to heading
To be honest, the hardest part of fixing this artifact wasn’t the trace file manipulation4, it was figuring out what the hell was going on in the first place! My first theory was that there was some async shenanigans that were causing the spikes, it was only when I decided to count the number of stack frames in a spike that the root problem was revealed.
After that revelation, it was only a matter of undoing the damage caused by the .NET EventPipe’s limit of 100 stack frames. If you’re also struggling with this limitation of the dotnet-trace tool, feel free to use this python script that I wrote alongside this blog post. I can’t promise that the script will work on every trace file, but after reading this blog post you know enough about its inner workings to handle any edge case you might find yourself!
-
A Manufacturing Execution System is a software system responsible for the bookkeeping of a factory’s production. It is generally used in highly sophisticated industries, such as the semiconductor industry and the medical devices industry, where a high level of material tracking and control is required. ↩︎
-
The terms “spike” and “discontinuity” are used interchangeably in this blog post to describe the same phenomenon. ↩︎
-
If you are trying to replicate this script, please be careful so that you don’t accidentally merge spans that weren’t meant to be merged. You can use the list of spike pointers to generate a table of spike timestamps, around which it should be fine to merge trace events. Please check this blog’s repository for a more bullet-proof version of
merge_spans()that takes the location of the spikes into consideration. ↩︎ -
I had already created trace files from scratch for a work project, maybe I’ll write more about that in the future. ↩︎