A couple of weeks after I published my guide on getting the most out of dotnet-trace, I started having a nagging thought in the back of my mind: could we do even better? And by “better” I mean capturing information on which SQL queries are being executed by our .NET application.
So, is it possible? Yes! Is it easy and convenient? …Not really.
The Good Link to heading
If your .NET application uses something like Microsoft.Data.SqlClient to talk to the database, then you are in luck, because this library is capable of emitting tracing events related to your SQL queries.
Collecting these SQL traces is simply a matter of ensuring the Microsoft.Data.SqlClient.EventSource provider is also included when running dotnet-trace collect:
dotnet-trace collect -p 135 --providers Microsoft.Data.SqlClient.EventSource:1:5,Microsoft-Windows-DotNETRuntime:0x100003801D:4,Microsoft-DotNETCore-SampleProfiler:0xF00000000000:4
Analysing the resulting .nettrace file with PerfView indeed confirms that we’ve captured the SQL Queries:
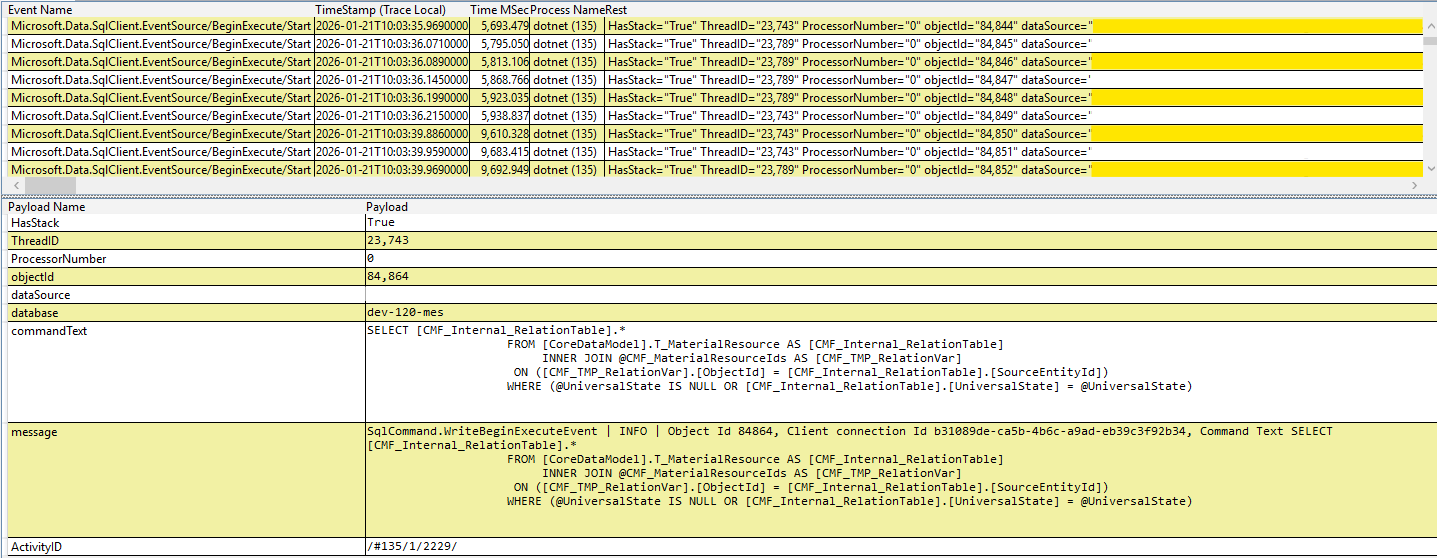
Microsoft.Data.SqlClient eventThe Bad Link to heading
We know that our SQL queries are present in the .nettrace file. Can we convert this file into a Chromium trace file, so that we can use Perfetto to analyse it?
Sadly, the answer is no: for some reason, you miss out on the SQL queries when converting .nettrace to .chromium.json files.
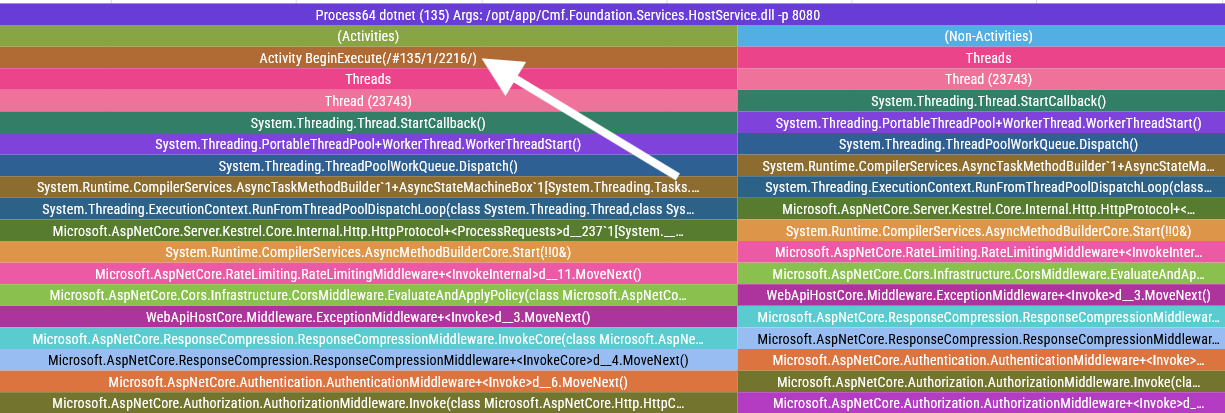
The Ugly Link to heading
But it gets worse! Not only do you not get the SQL queries in your trace files, but you also are greeted with these incredibly annoying “Activity BeginExecute” slices that do absolutely nothing other than cluttering your traces.
The Fix Link to heading
I can live with these ugly “Activity BeginExecute” slices1, but we have to find a way to embed the SQL query data in our chromium traces.
After some digging, I discovered that dotnet-trace delegates the nuances of converting formats to the Microsoft.Diagnostics.Tracing.TraceEvent dependency. Using this package seems to be the recommended way of dealing with .nettrace files, so I decided not to reinvent the wheel and took advantage of this package to create a script that adds the missing SQL events to my trace files.
I will spare you the implementation details, but if you are interested in running this yourself, you can download the code here.
Usage example:
dotnet run AddSqlEvents.cs --nettrace-file .\dotnet_20260121_100330.nettrace --chromium-trace-file .\dotnet_20260121_100330.chromium.json --output test.chromium.json
When you open your newly generated trace file, you will now have your precious SQL queries available to be analysed!
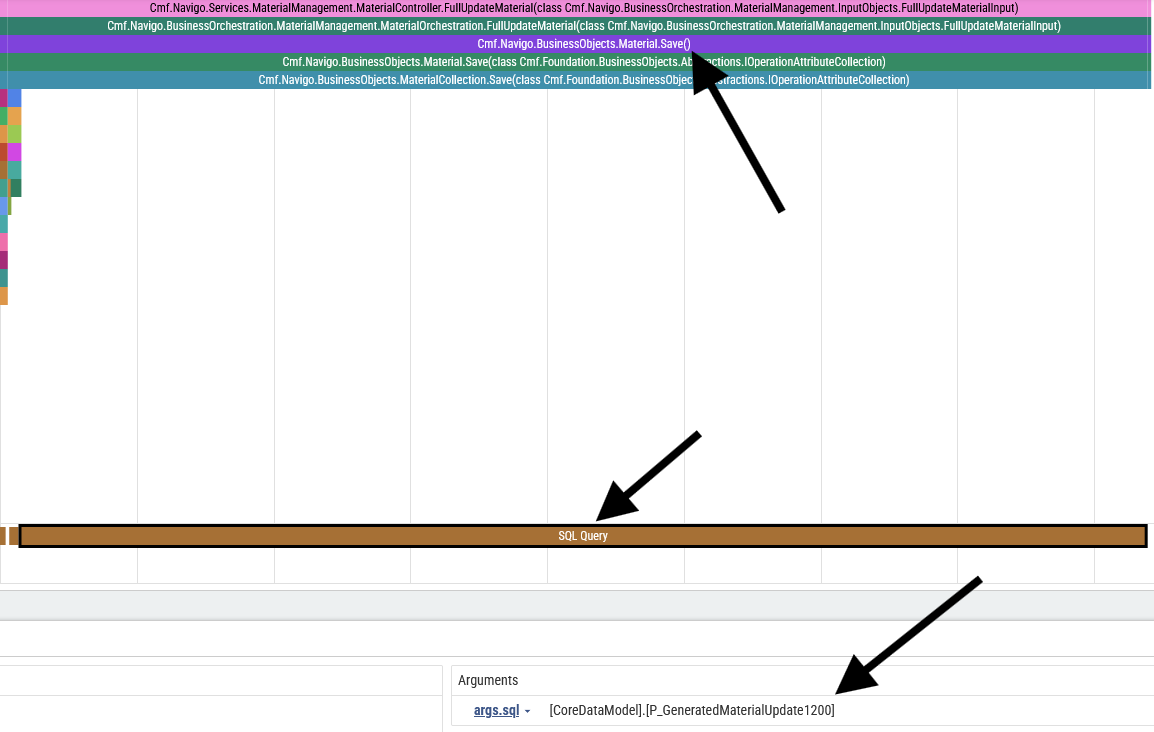
Material.Save() function call has a matching "SQL Query" span, which contains information regarding which SQL was executed: in this case, it was the [CoreDataModel].[P_GeneratedMaterialUpdate1200] procedure.The End Link to heading
So it’s possible to embed SQL query data in your dotnet-trace-generated traces, but given the ordeal one has to go through to make this information available in Perfetto, I doubt many people will take advantage of this. Even for me, the person who wrote a script to fix this problem, this is way too much work!
At least I can take solace in the fact that I demonstrated that it can be done, even if it isn’t easy. Who knows, maybe this blog post will give someone the motivation to make this work seamlessly out of the box. If you are that someone, I will be cheering you on!
-
You can use Perfetto to filter these slices if necessary. ↩︎