As the software industry transitioned towards more cloud-centric environments, programming languages have had to focus on treating virtualized Linux environments as first-class citizens or risk getting left behind. C# was no exception and for this language to maintain its popularity, Microsoft had to perform a complete overhaul of the .NET runtime to make it cloud-ready.
As part of this initiative to make .NET platform-agnostic, a supporting cast of CLI diagnostic tools was developed from scratch with the goal of uniformizing the developer experience of diagnosing C# applications across operating systems. One of these tools is dotnet-trace: a tool that can be hooked into a running .NET application to collect tracing data which can then be analysed with trace viewers.
In an ongoing effort to popularize the usage of performance diagnostics tools during development at my workplace, I’ve been working out the kinks of using dotnet-trace to analyse the performance of my company’s multithreaded ASP.NET Core application. I have also been testing various trace viewers to analyse dotnet-trace files with, and in my opinion there is no discussion to be had: dotnet-trace and the Perfetto trace viewer are a match made in heaven, especially when you have to analyse complex trace files with multiple threads!
In this blog post I will show how you can use a combination of dotnet-trace & Perfetto to collect traces from a running application, and then perform post-processing on those traces so that the focus is always on the parts of the call stack that matter.
Collecting traces with dotnet-trace Link to heading
Installing dotnet-trace Link to heading
If you don’t have this tool already installed there are two ways of installing it:
dotnet tool install --global dotnet-trace- Download the executable from the official page
Please note that the dotnet-trace tool needs to be in the same execution environment as the target .NET application.1
If you’re running your .NET application in a locked-down Docker container, it might not be possible to run dotnet tool install, so your only1 option will be to download the Linux executable and move it to the container’s filesystem by either:
- Running something like
docker cp dotnet-trace custom_host:/opt/app/dotnet-trace2, or… - Placing the executable in a folder that your .NET container can reach3
Running dotnet-trace Link to heading
Now that dotnet-trace is installed, we can run it against our application. Before we start collecting traces, we need to figure out the PID of our application:
-
Log in to your container first if necessary
docker exec -it custom_host /bin/bash -
Run
dotnet-trace psto get a list of the .NET processes in the docker containerbash-4.4# ./dotnet-trace ps 1 CmfEntrypoint /usr/share/CmfEntrypoint/CmfEntrypoint r=host --target-directory=/opt/app --allow-custom-certificates --distro=ubi8 19 dotnet /usr/lib64/dotnet/dotnet dotnet Cmf.Foundation.Services.HostService.dll -p 8080
Our application is running on PID 19. Let’s collect some data by running dotnet-trace collect! The target process is determined by the -p flag, and --format Chromium determines the intended format: a .chromium.json file that can be read by the Perfetto trace viewer.
bash-4.4# ./dotnet-trace collect -p 19 --format Chromium
No profile or providers specified, defaulting to trace profile 'cpu-sampling'

Provider Name                           Keywords            Level               Enabled By
Microsoft-DotNETCore-SampleProfiler     0x0000F00000000000  Informational(4)    --profile
Microsoft-Windows-DotNETRuntime         0x00000014C14FCCBD  Informational(4)    --profile

Process        : /usr/lib64/dotnet/dotnet
Output File    : /opt/app/dotnet_20251230_003728.nettrace
[00:00:00:06]   Recording trace 1.0175   (MB)
Press <Enter> or <Ctrl+C> to exit...
Now that dotnet-trace is collecting data, make sure that the application is doing something interesting: click some buttons, call some APIs, run some integration tests, do whatever you see fit.
When you’re done, press Enter or Ctrl+C to stop the collection process and create a trace file. You’ll get some output in your terminal similar to this:
Stopping the trace. This may take several minutes depending on the application being traced.

Trace completed.
Processing trace data file '/opt/app/dotnet_20251230_003728.nettrace' to create a new Chromium file '/opt/app/dotnet_20251230_003728.chromium.json'.
Conversion complete
Retrieving the trace file Link to heading
If our .NET application is running in a container, we might still need to rescue the trace file from the container’s filesystem:
docker cp custom_host:/opt/app/dotnet_20251230_003728.chromium.json dotnet_20251230_003728.chromium.json
Analysing traces with Perfetto Link to heading
Now that we have captured our tracing data, head over to the Perfetto trace viewer webpage and open your trace file. You should get something like this:
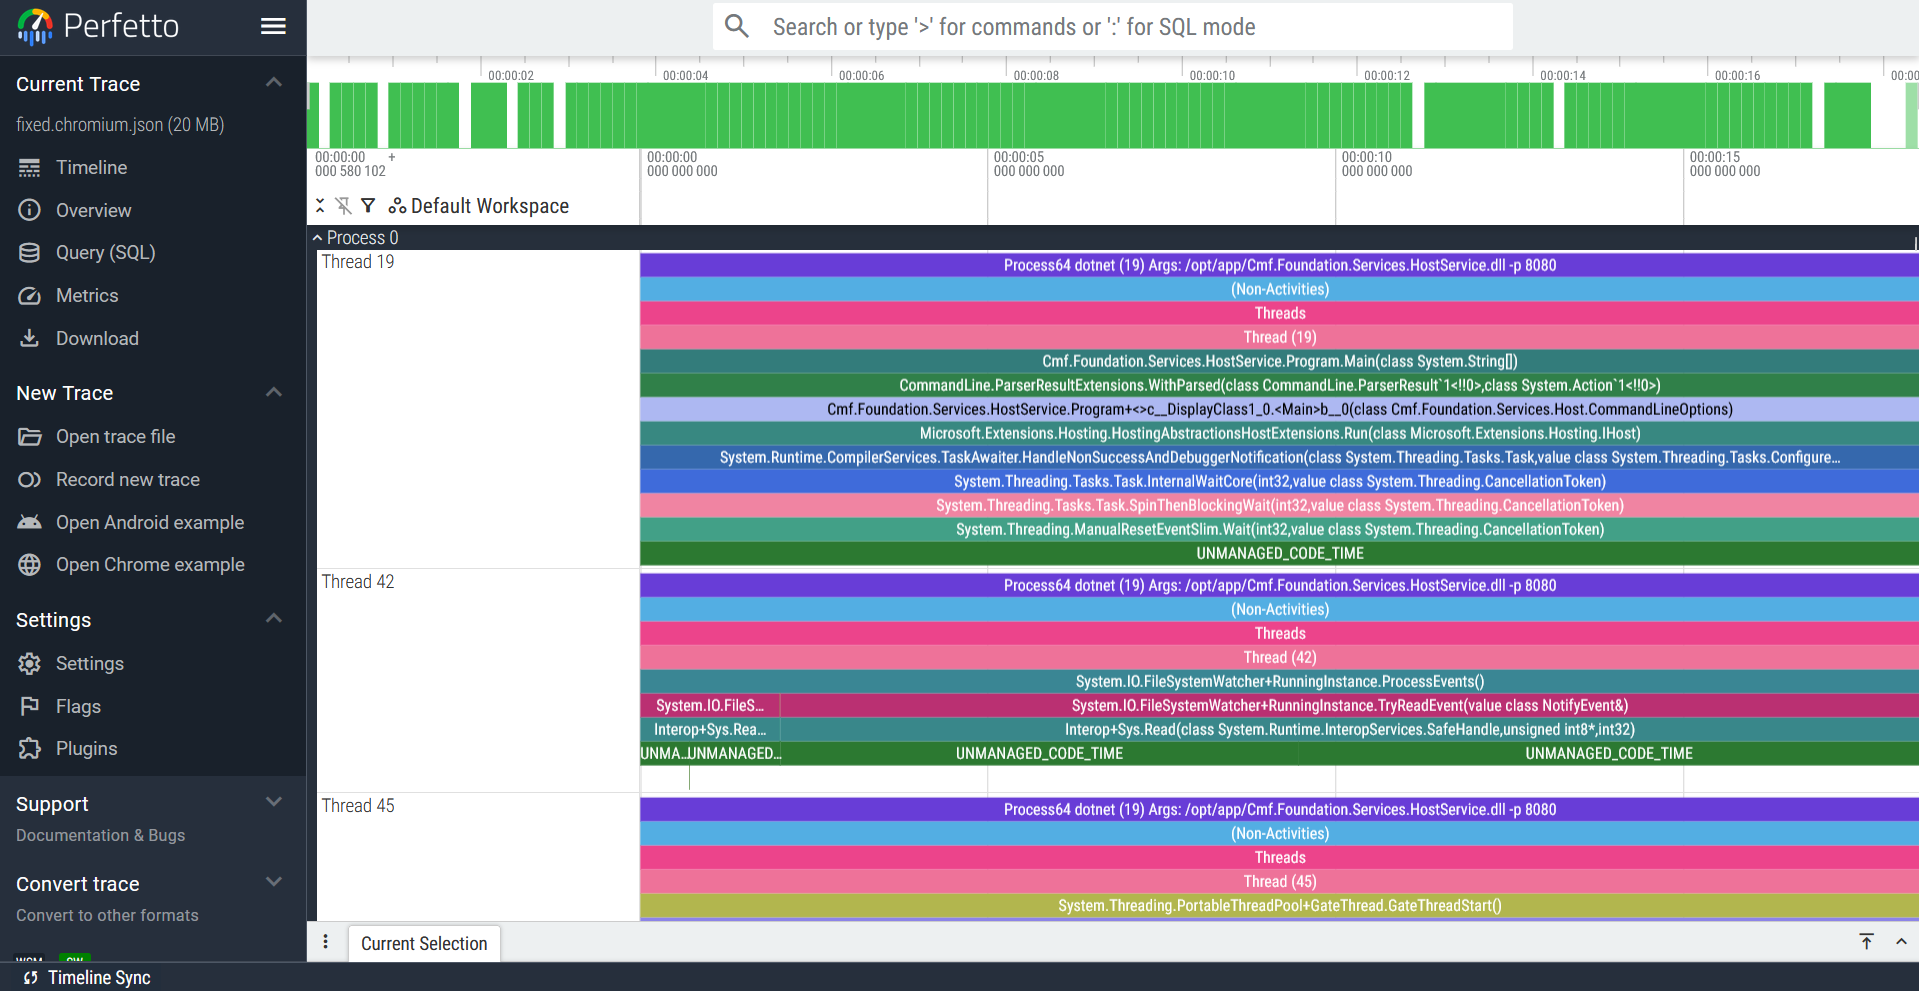
The trace file that will be analysed in this blog post was captured from Critical Manufacturing’s host, which serves as the backend for the MES4 system sold by the company. This will naturally mean that the analysis done here will be tailored towards this application, but the techniques to be shown below can be applied to any trace file you analyse with Perfetto.
Navigating the Perfetto UI Link to heading
These are the basic controls needed to navigate this trace viewer:
- Use the scroll wheel to scroll up and down the thread list
- Use the WASD keys to zoom in and out (WS) and move right or left
If you click on a trace slice, a tab called “Current Selection” will appear at the bottom of the screen with all the information related to this slice. If the selected slice is out of sight, you can press F to center the trace viewer on it.
This is just the tip of the iceberg though: for more information on all things Perfetto, head over to their documentation page.
Taking a bird’s eye view of the trace file Link to heading
Before diving headfirst into a service call, let’s stay zoomed out and take stock of what’s in this trace file.
Starting from the top, the first thing I notice are about 10 threads that are sitting around doing nothing of interest.
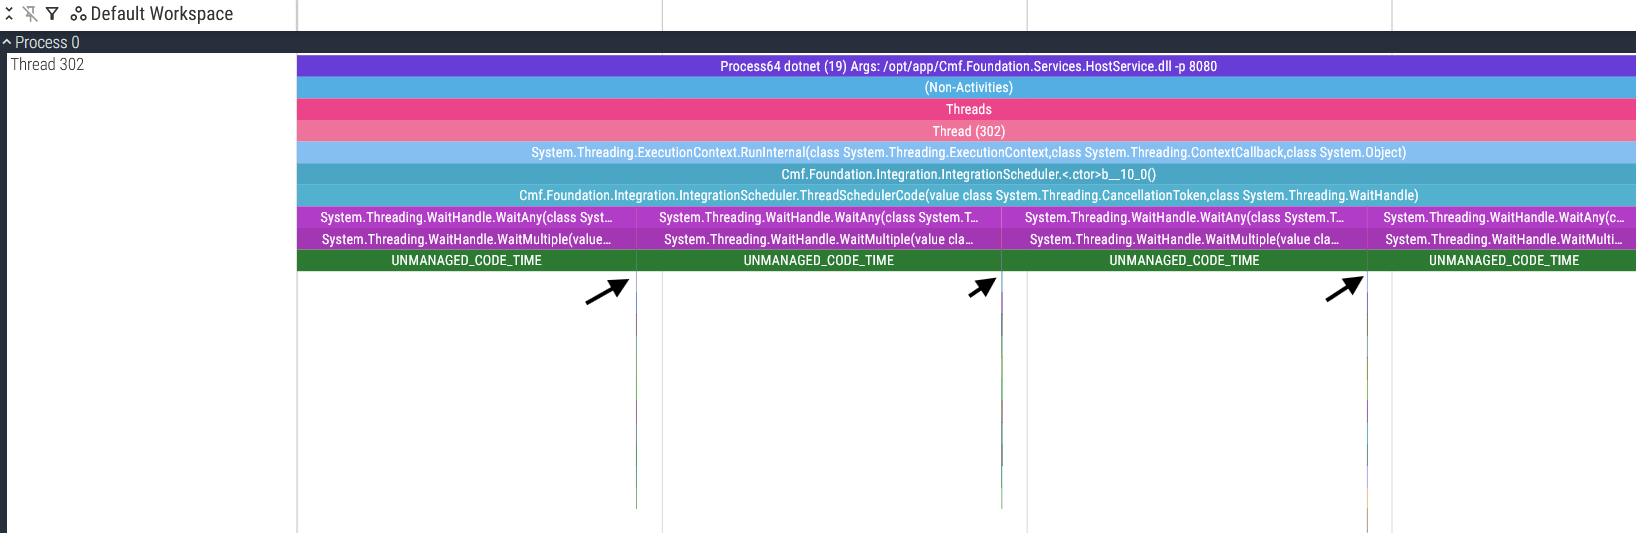
Thread 302 Link to heading
Actually, I’d like to make an exception: Thread 302 is polling every 5 seconds for any new integration entries queued for execution.
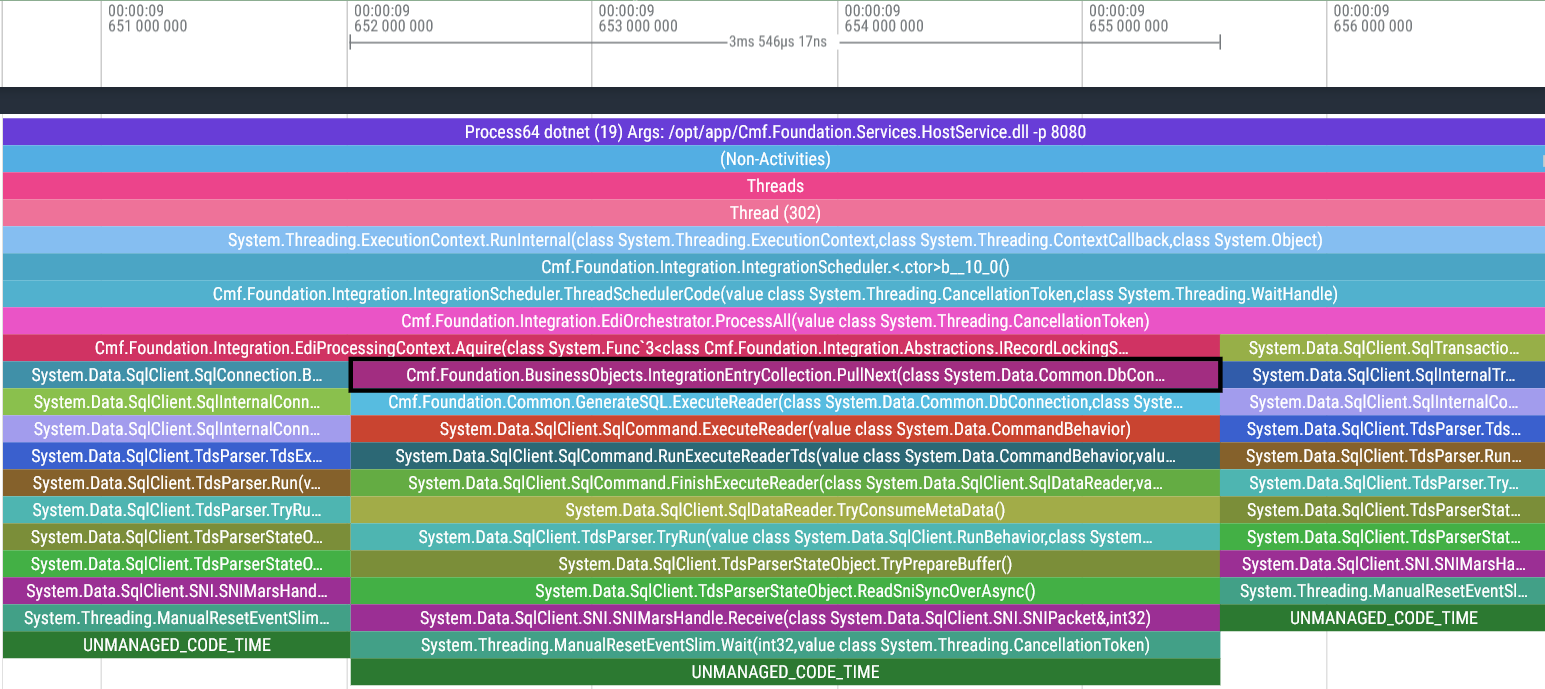
The service call threads Link to heading
Now that we’ve left the boring threads behind us, the only threads remaining are the threads that execute host services, which are by far the threads we care about the most! In the same way that all roads lead to Rome, every single MES service call goes through the host. It is therefore imperative that the host doesn’t become a bottleneck for the MES by making sure these services are fast and access the database efficiently.
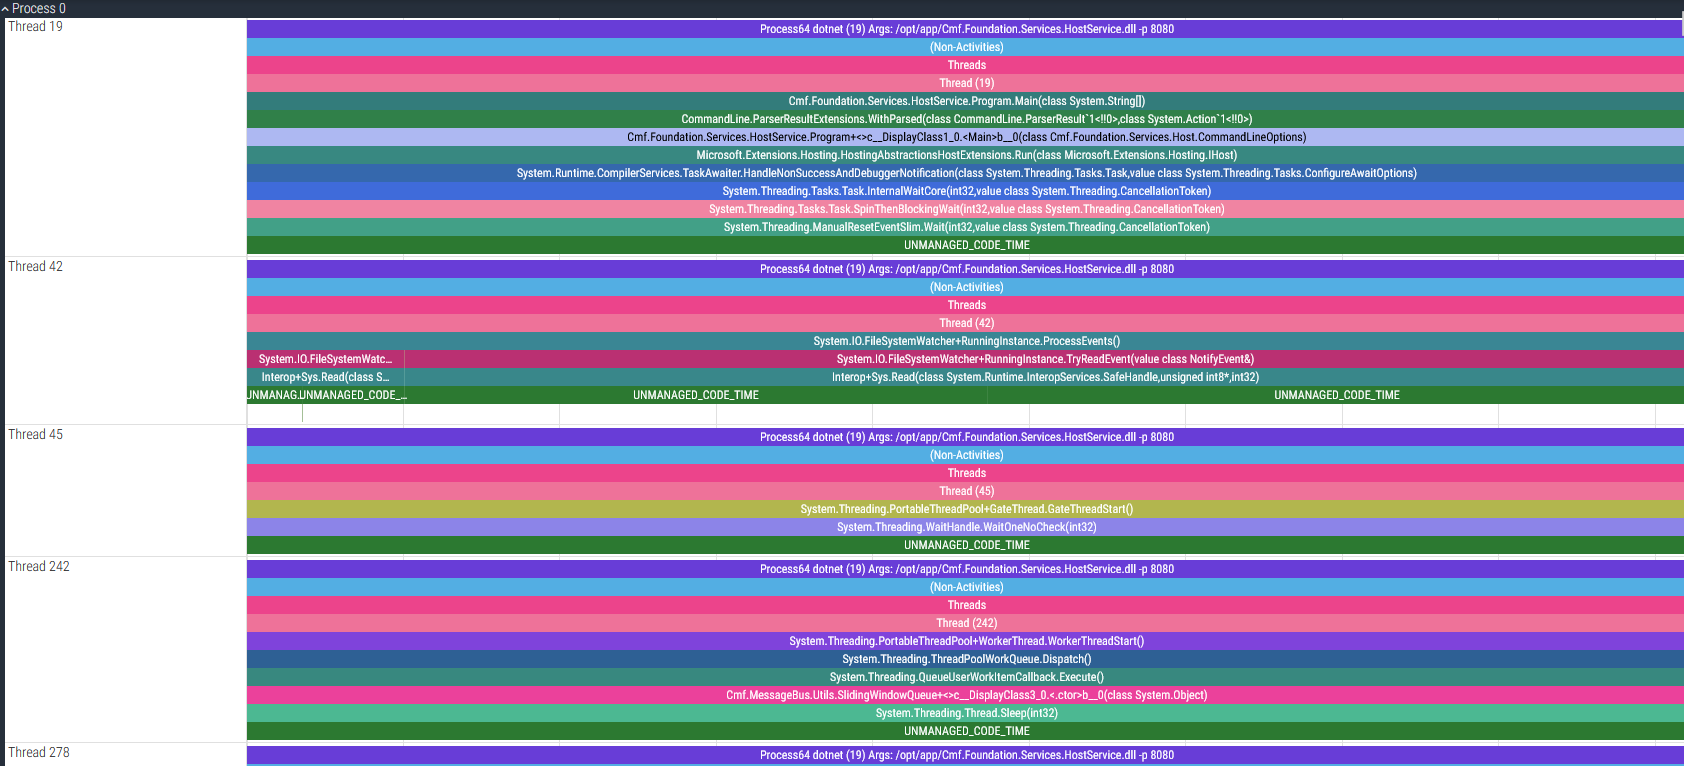
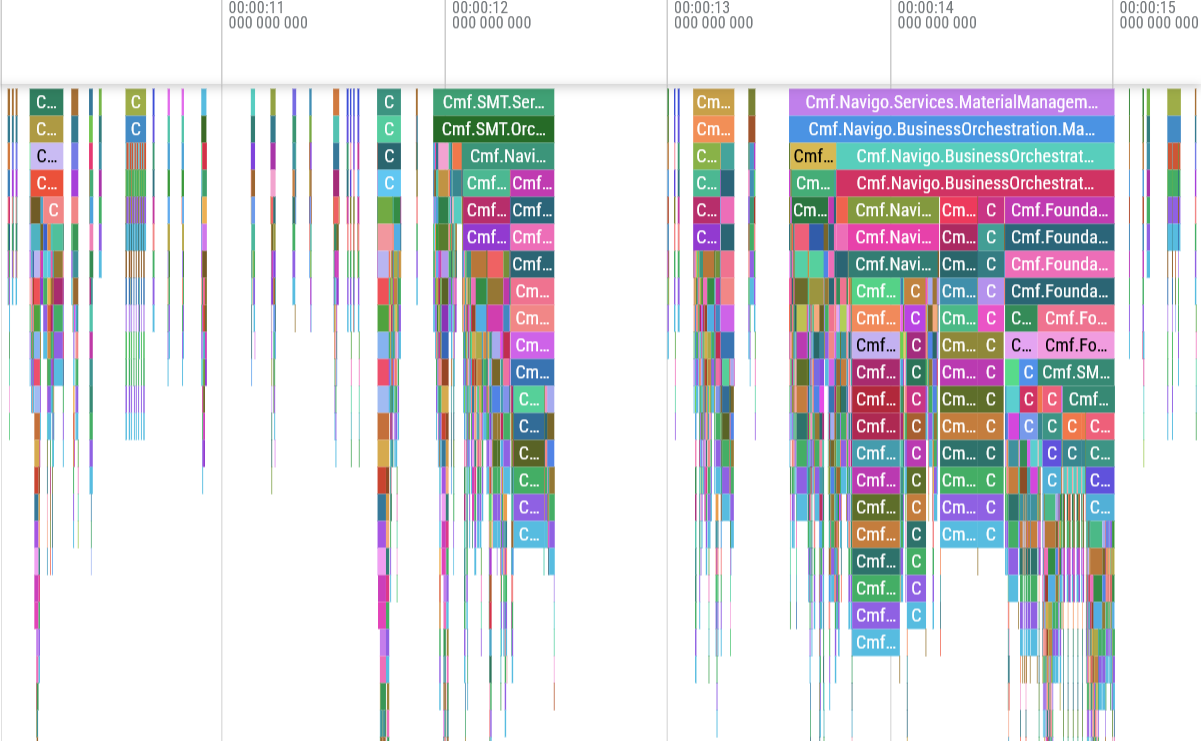
Let’s now take a look at how these service threads look in the Perfetto Trace viewer:
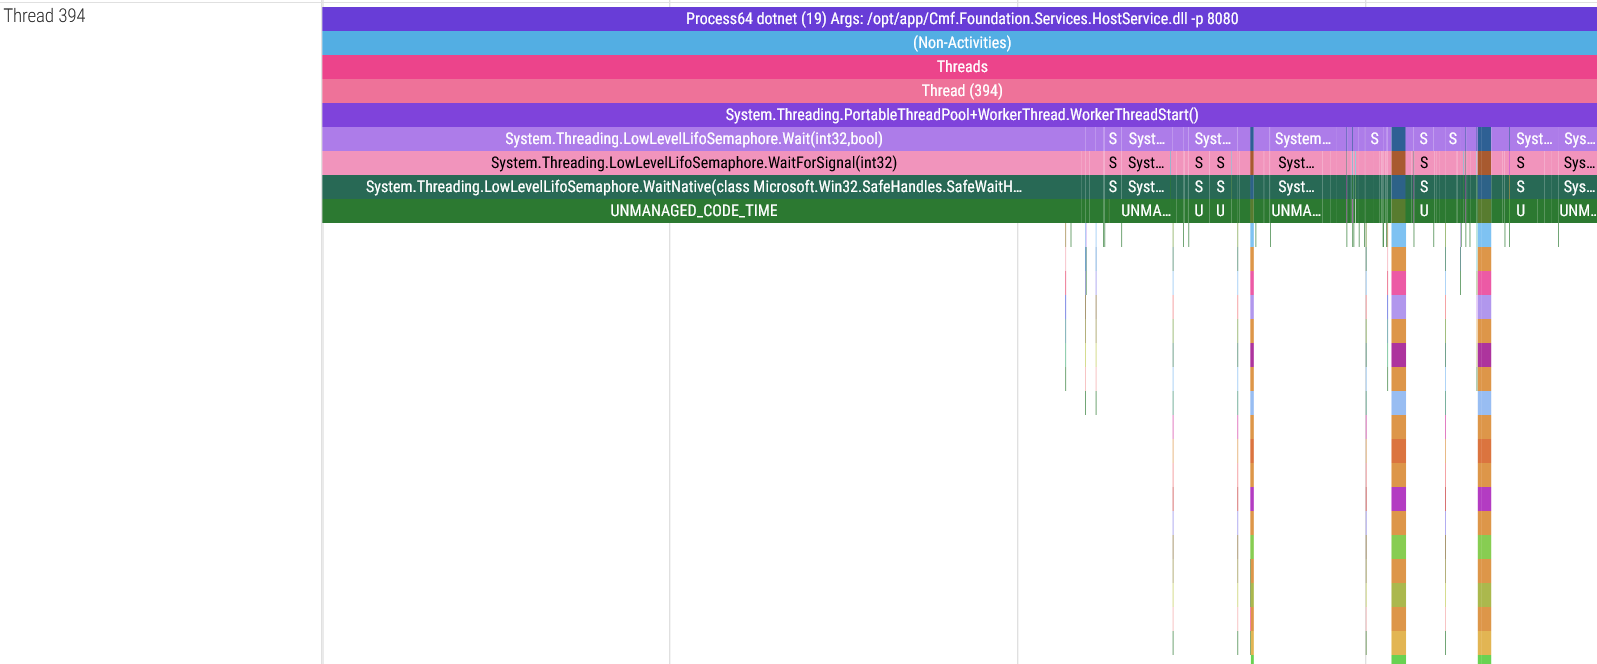
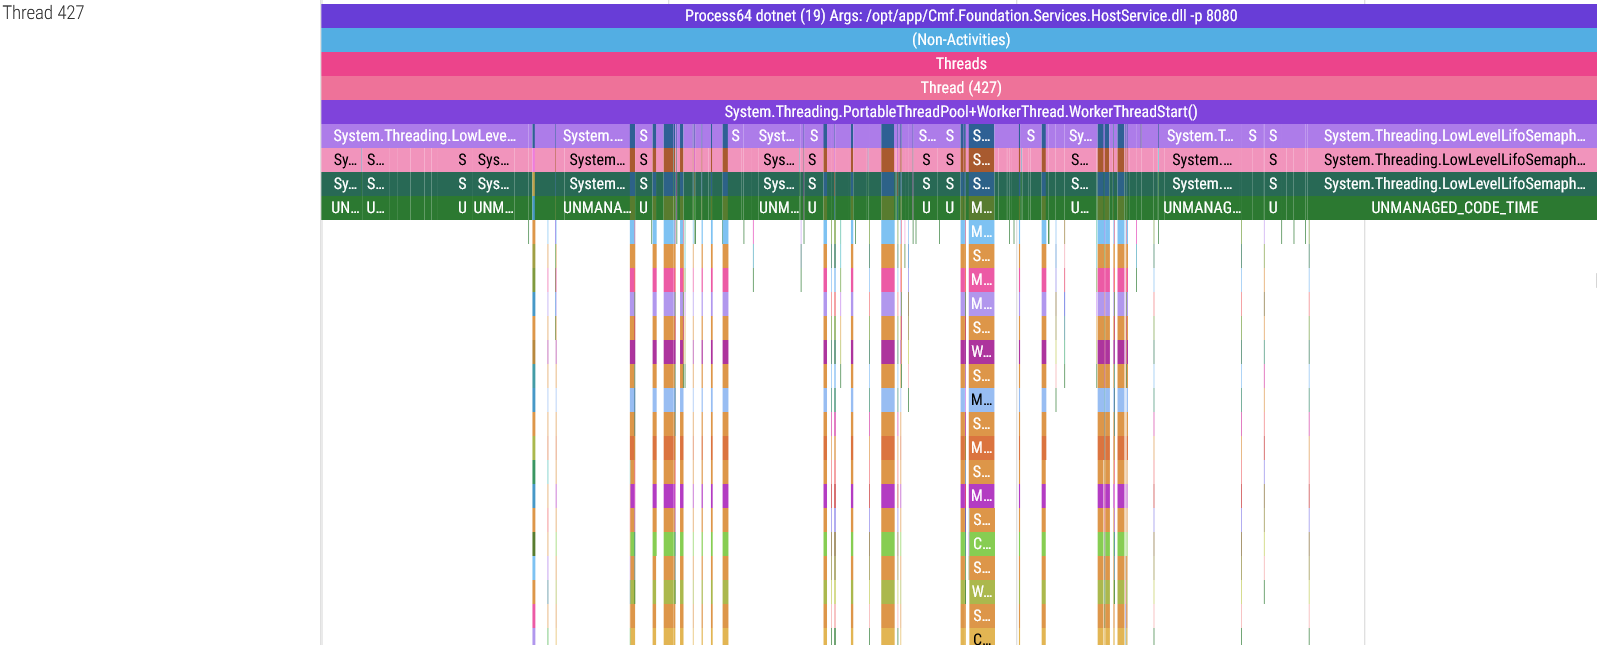
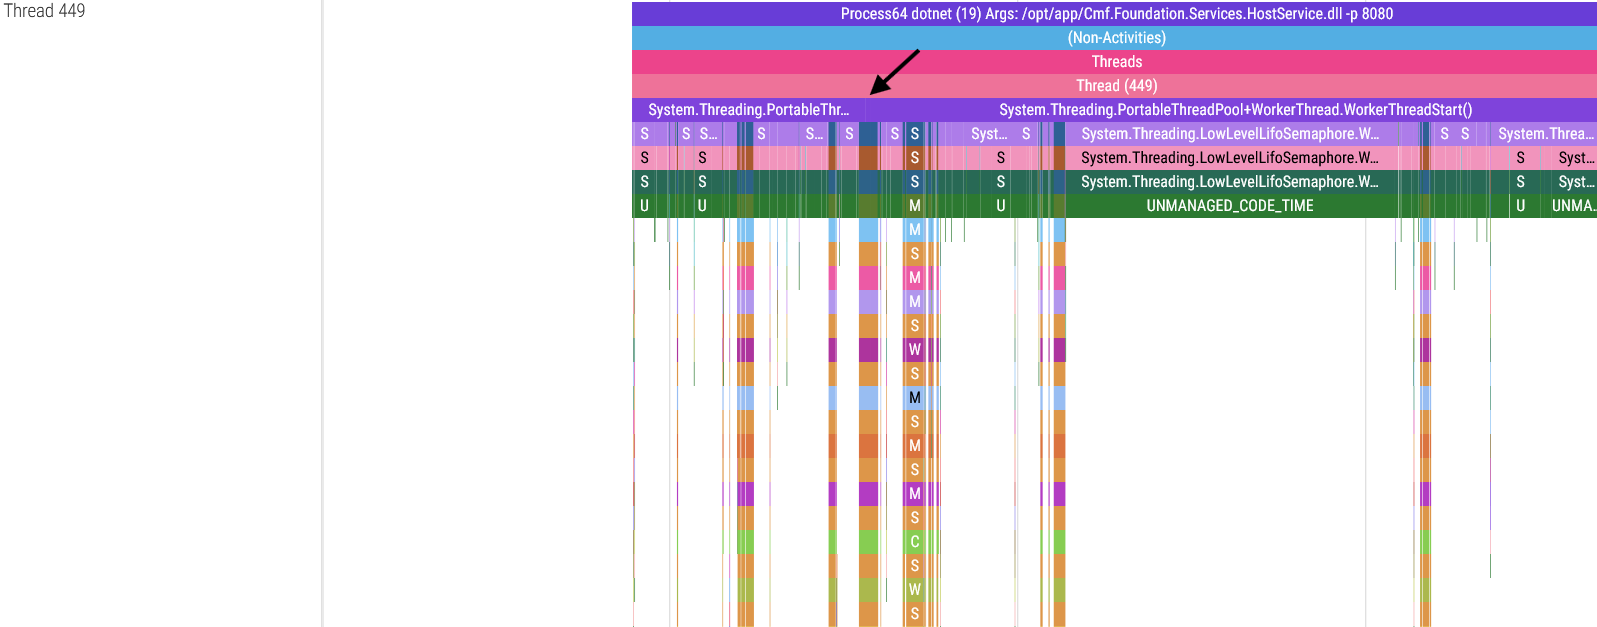
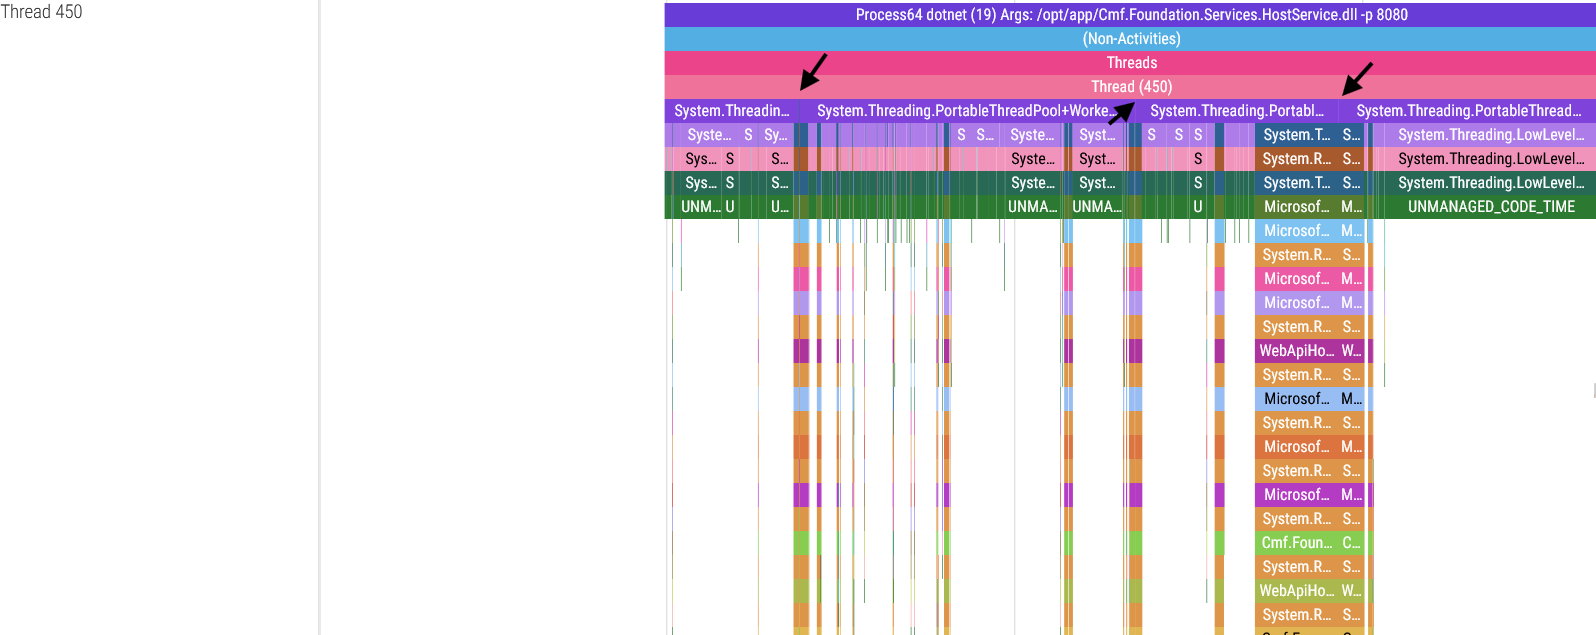
These threads spend most of their time waiting for a service call, and once they receive an API request they execute the requested service (represented by the call stack “towers” in the images above) and return a response. The wider these service calls are in the trace viewer, the longer the service took to run.
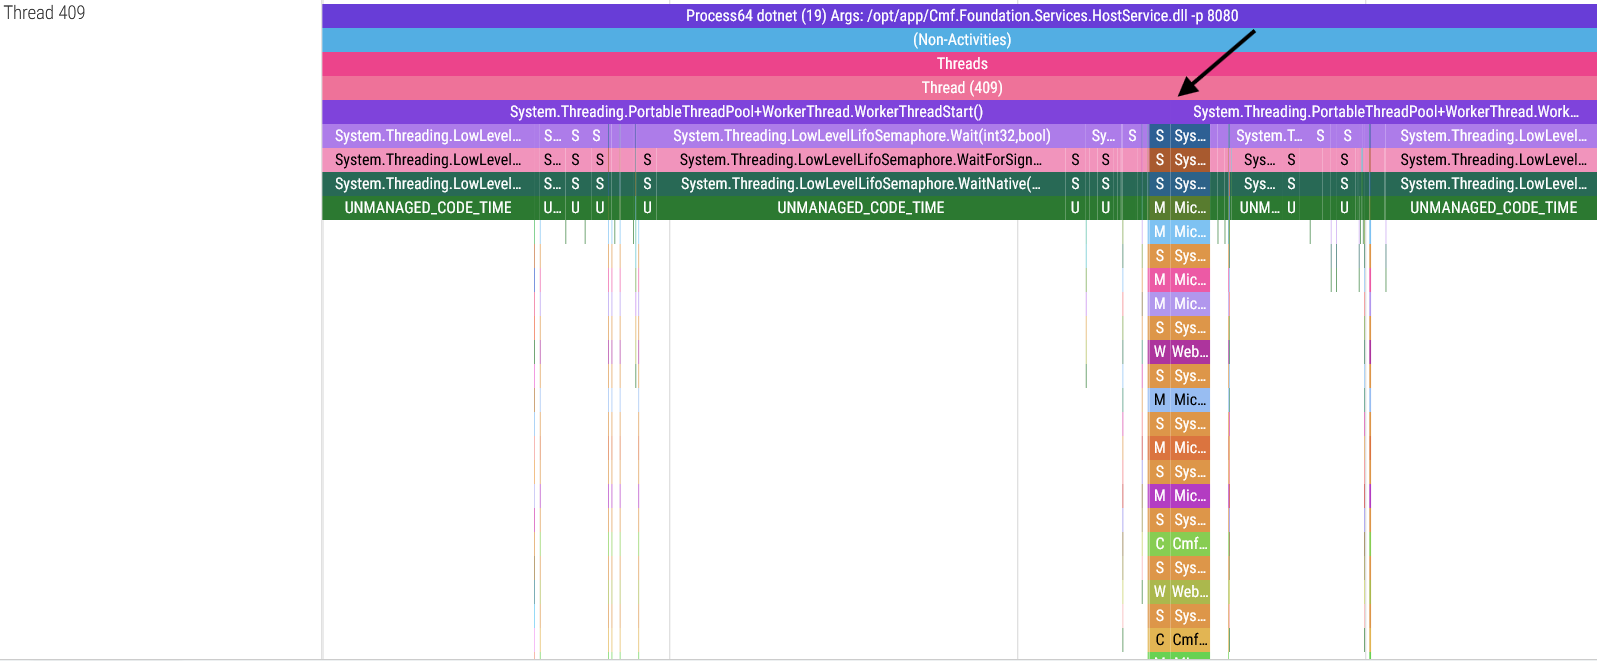
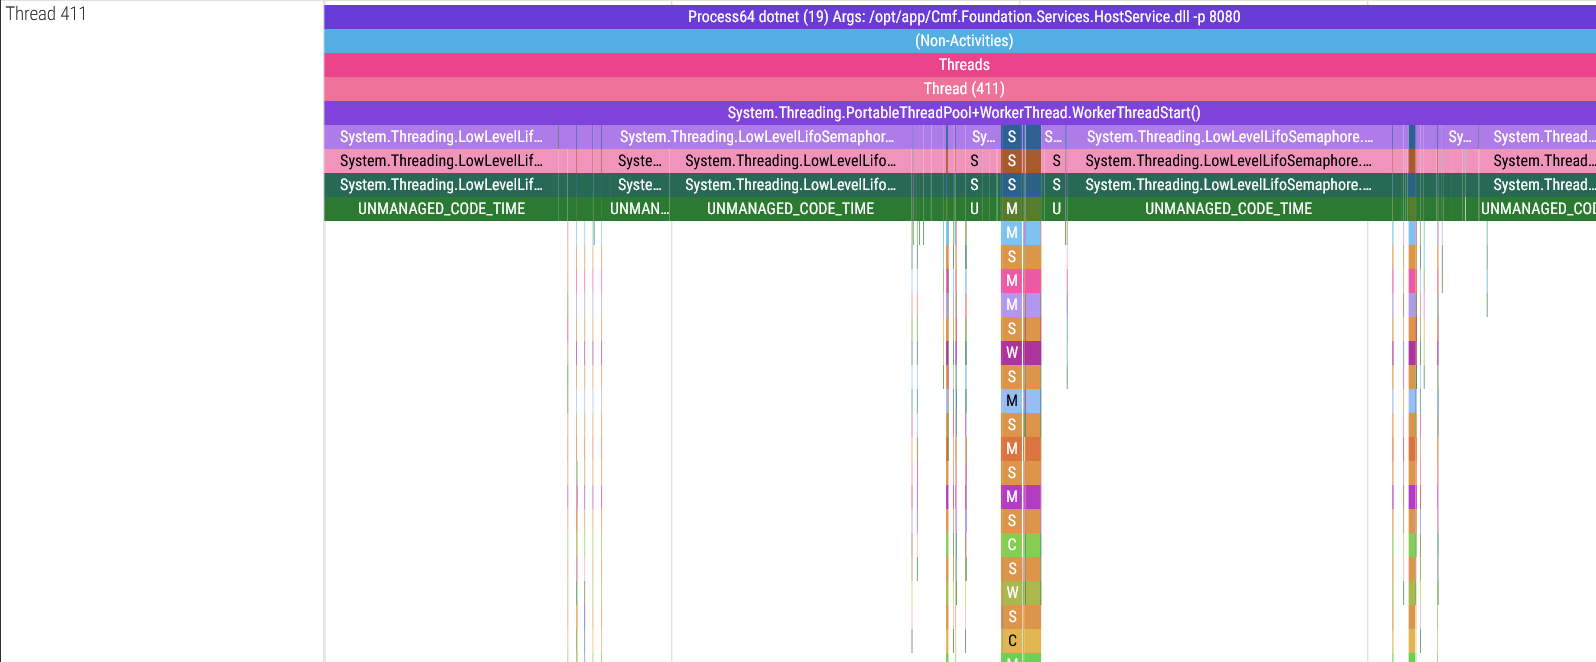
dotnet-trace’s limit of 100 stack frames Link to heading
There is a detail in these screenshots I must point out: in some threads, the System.Threading.PortableThreadPool+WorkerThread.WorkerThreadStart() base function goes continuously from the start to the end of the thread, but in the threads 409, 449 and 450 you will notice that this function is broken up in the spots indicated by the arrows. There is a reason for this: dotnet-trace can only capture a maximum of 100 stack frames, meaning that if your call stack is more than 100 stack frames long, the oldest frames get cut to meet this limit. Thankfully this can be fixed but trust me, figuring out a workaround for this limitation wasn’t easy.
Using the script linked above is quite straightforward:
PS C:\Users\Daniel\Desktop\github\blog\dotnet-trace> python .\fix_spikes.py .\dotnet_20251230_003728.chromium.json
fixed_dotnet_20251230_003728.chromium.json
The anatomy of a host service call Link to heading
We took the 30,000-foot view in the previous section, now it’s time to put one of these service calls under the microscope. These services’ call stacks are absolutely massive (~100 stack frames), so we’re going to start at the base of the trace and work our way down:
Part 1: ASP.NET middleware Link to heading
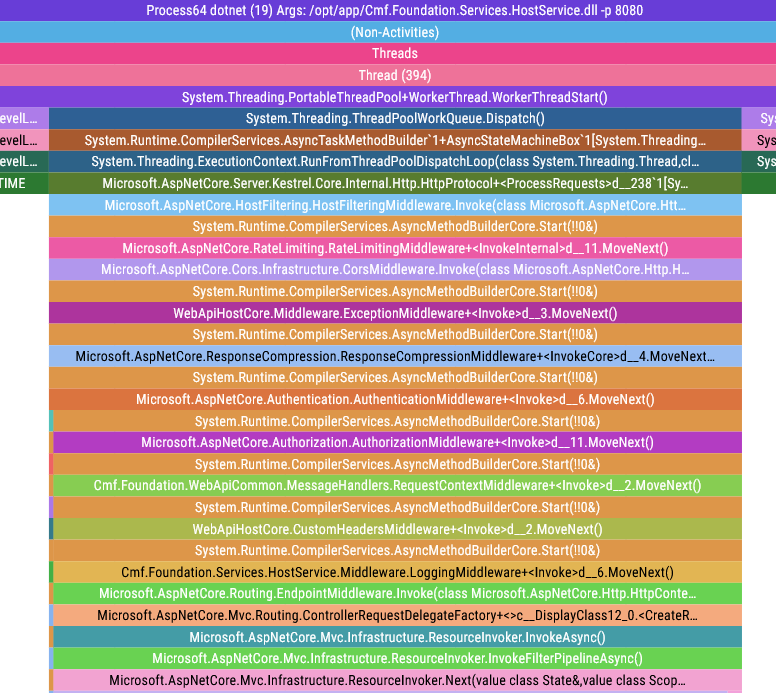
We start off with a bang and a metric ton of ASP.NET middleware. Just from this picture we can tell that our host is configured to have the following features:
- Rate Limiting
- CORS
- Authentication
- Authorization
- Logging
- etc.
Part 2: More middleware & handling of the HTTP request Link to heading
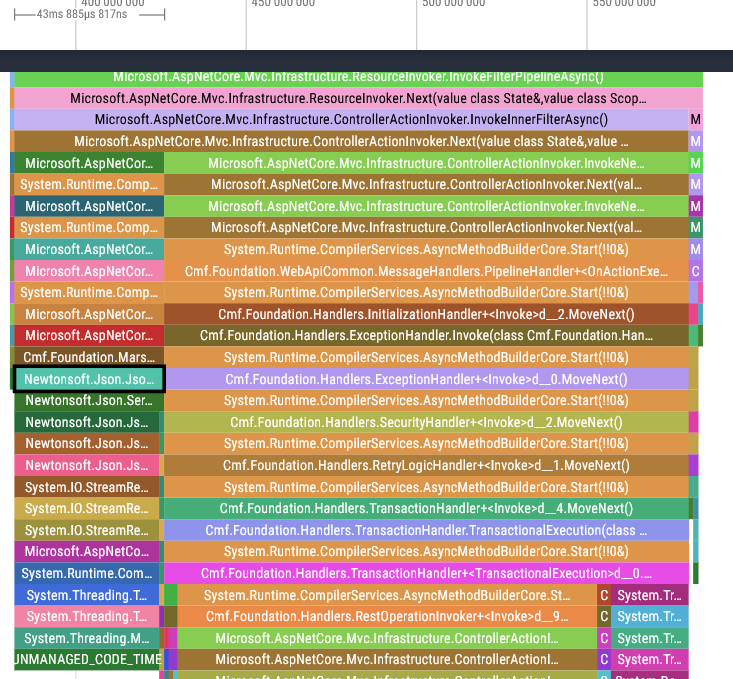
Going further down we get even more middleware, but perhaps more interestingly we have the first big time sink of the service call: deserializing the incoming REST JSON request (43ms).
On the right side of the trace (towards the top-right of the picture) we can also see the HTTP response being created and sent back to the caller of this service. To the surprise of absolutely no one, serializing the response back to JSON is an order of magnitude quicker, clocking in at 4ms.
Part 3: DB transaction Link to heading
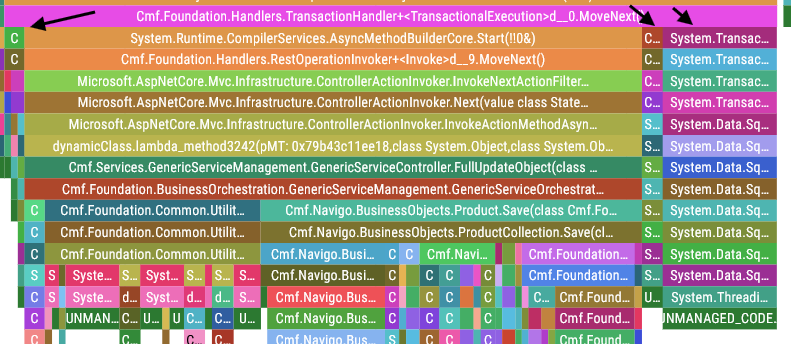
It’s transaction time. The arrows indicate the time spent opening and closing this database transaction:
Cmf.Foundation.Common.HistoryObjectCollection.CreateTransaction(int64, String)- 4.25msCmf.Foundation.Common.HistoryObjectCollection.CloseTransaction()- 4.1msSystem.Transactions.TransactionScope.Dispose()- 23ms
Part 4: Business logic Link to heading

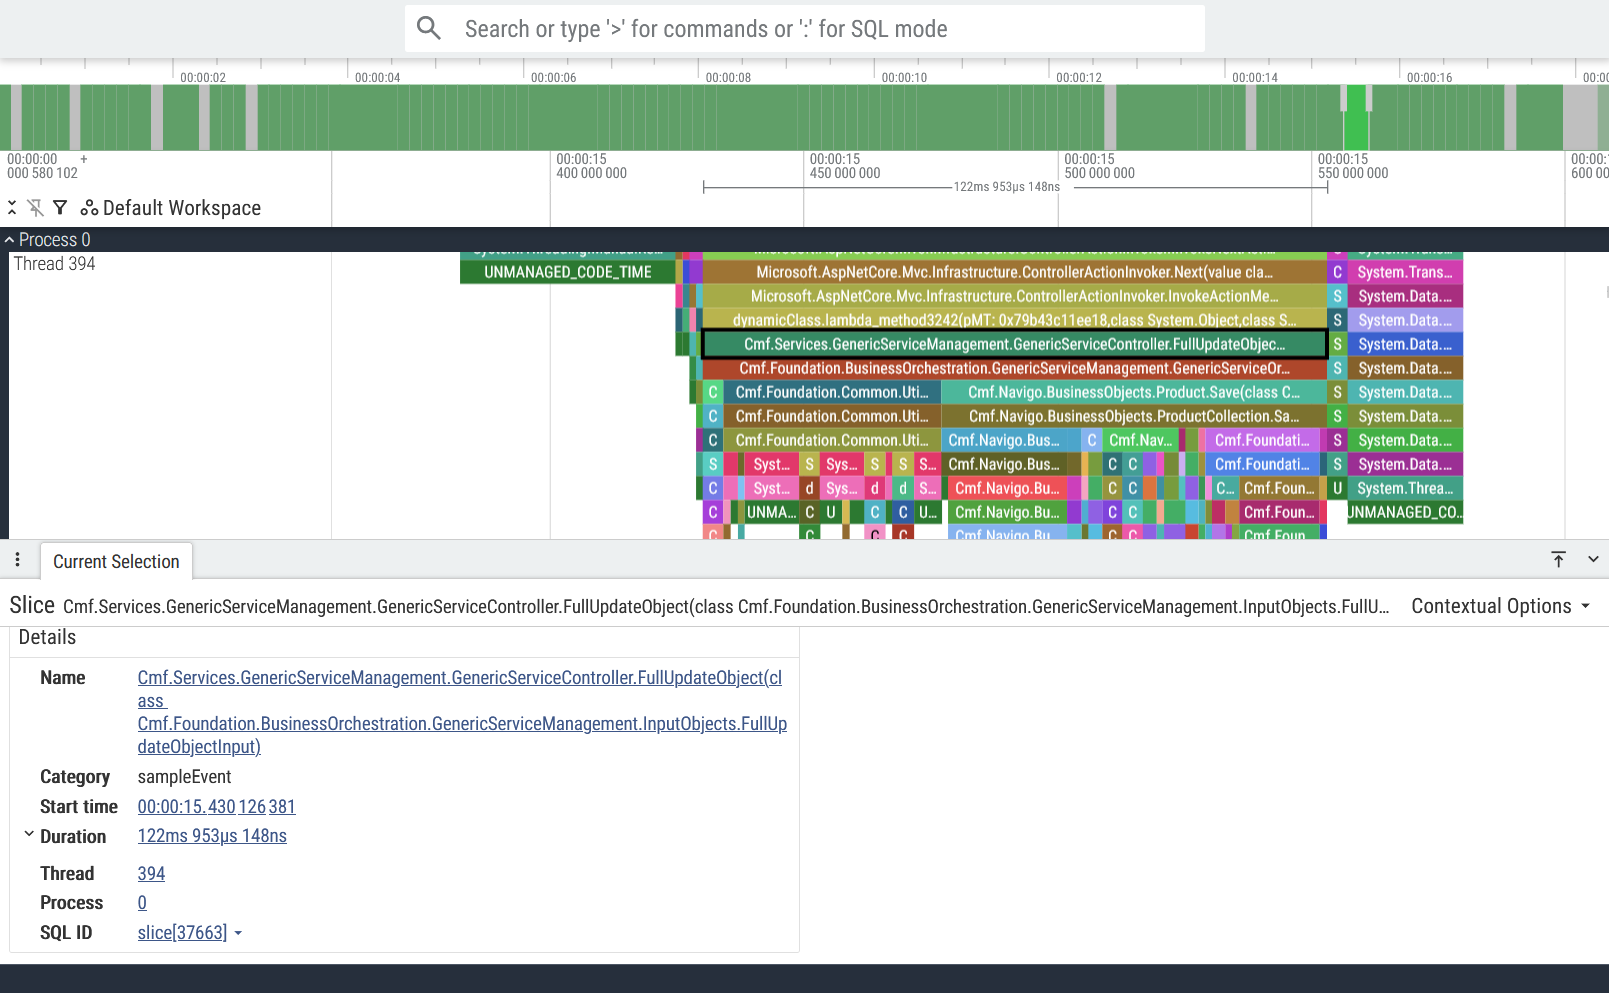
We finally know what service is being called! FullUpdateObject() is being called to update a Product. We can tell this by looking at the call stack:
Cmf.Services.GenericServiceManagement.GenericServiceController.FullUpdateObject()Cmf.Foundation.[...].GenericServiceOrchestration.FullUpdateObject()- …
Cmf.Navigo.BusinessObjects.Product.Save()- Database calls, etc
Every host service call is structured in this manner: The service layer calls the orchestration layer, which in turn calls other services and/or operations on the required entities.
Making sense of all these service call traces Link to heading
So, to take stock of the situation: every time we want to analyse the performance of a service, we have to skip 60 stack frames of middleware just to get to the business logic. Oh, and these service traces are spread across 10 different threads, so good luck finding the service you are interested in… well isn’t that great.
Luckily for us we have an ace up our sleeve: how good is your SQL?
Introducing PerfettoSQL Link to heading
Perfetto is already pretty good if you only use it as a basic trace viewer. However, what makes it exceptional for handling massive amounts of trace data is its ability to use SQL queries to analyse your traces, and we’re going to make full use of this capability to make our lifes easier.
To access Perfetto’s SQL editor, please select “Query (SQL)” in the sidebar on the left:
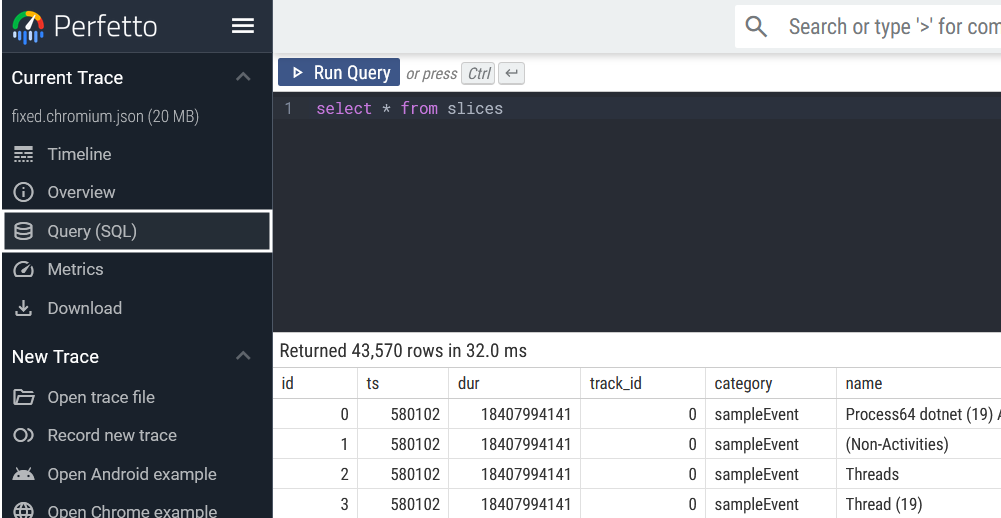
Absolutely everything in your trace file is queryable through PerfettoSQL, but today we will only focus on the slices table. In the screenshot above we executed the following query:
select * from slices
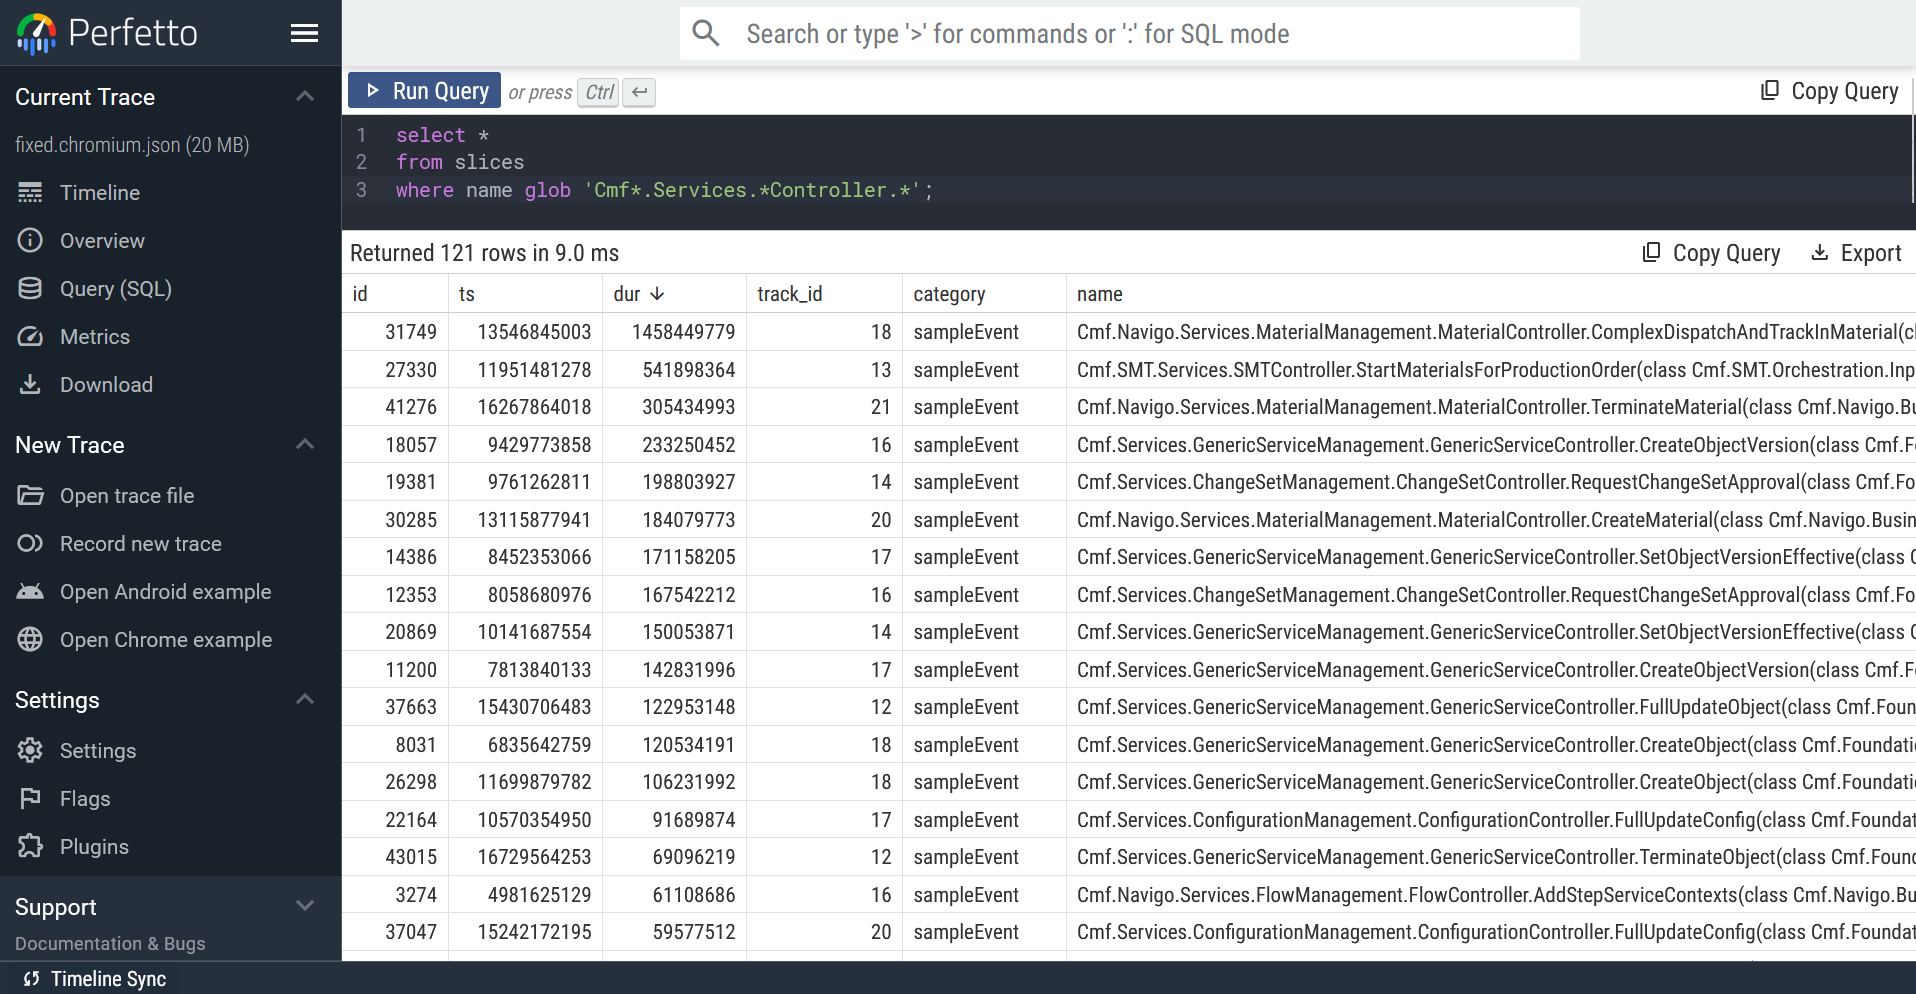
This query will naturally return every single function slice in the trace file. Crafting a query that will only yield the service spans we’re interested in takes a bit more nuance, but is perfectly doable:
select * from slices where name glob 'Cmf*.Services.*Controller.*';
Visualizing your queries with debug tracks Link to heading
While a lot can be gleaned just from querying the trace file, we can go one step further and visualize our query results directly on the timeline alongside all the other traces by creating a debug track.
Please follow the instructions below to create a debug track from a query:
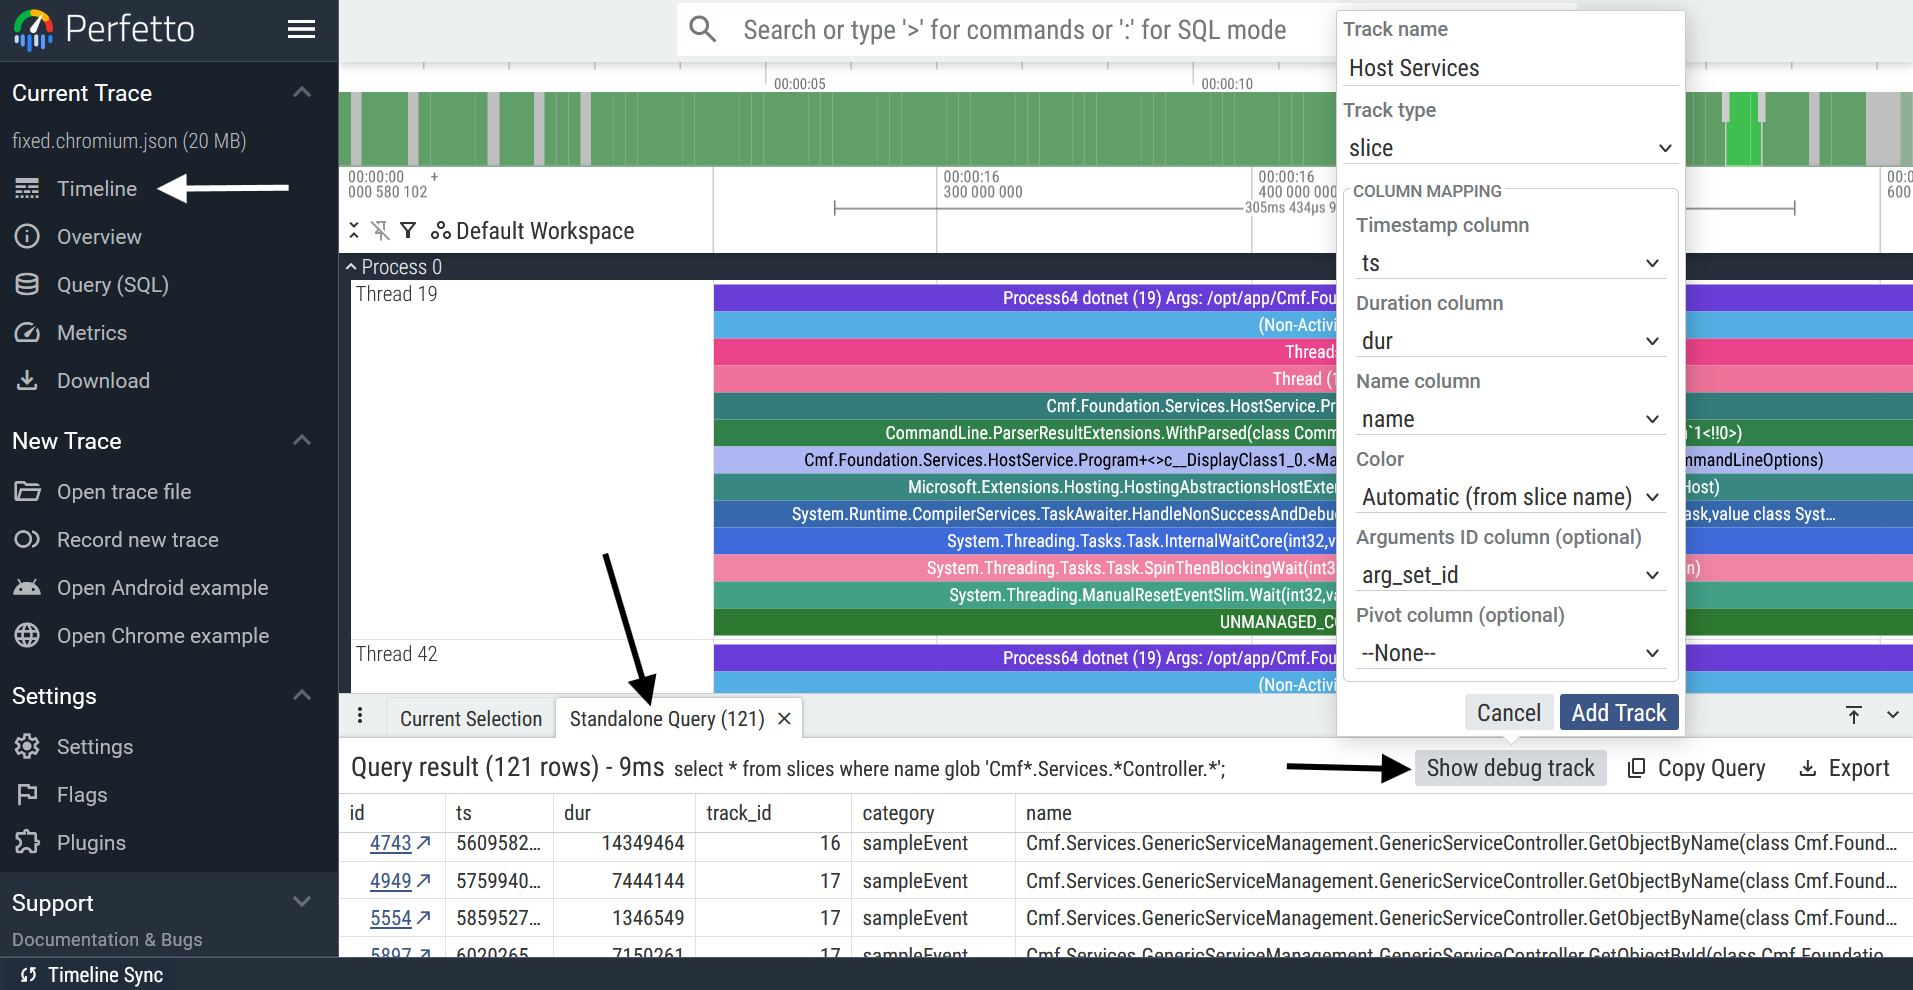
Clicking “Add Track” creates the debug track and adds it to the top of your workspace, as can be seen here:
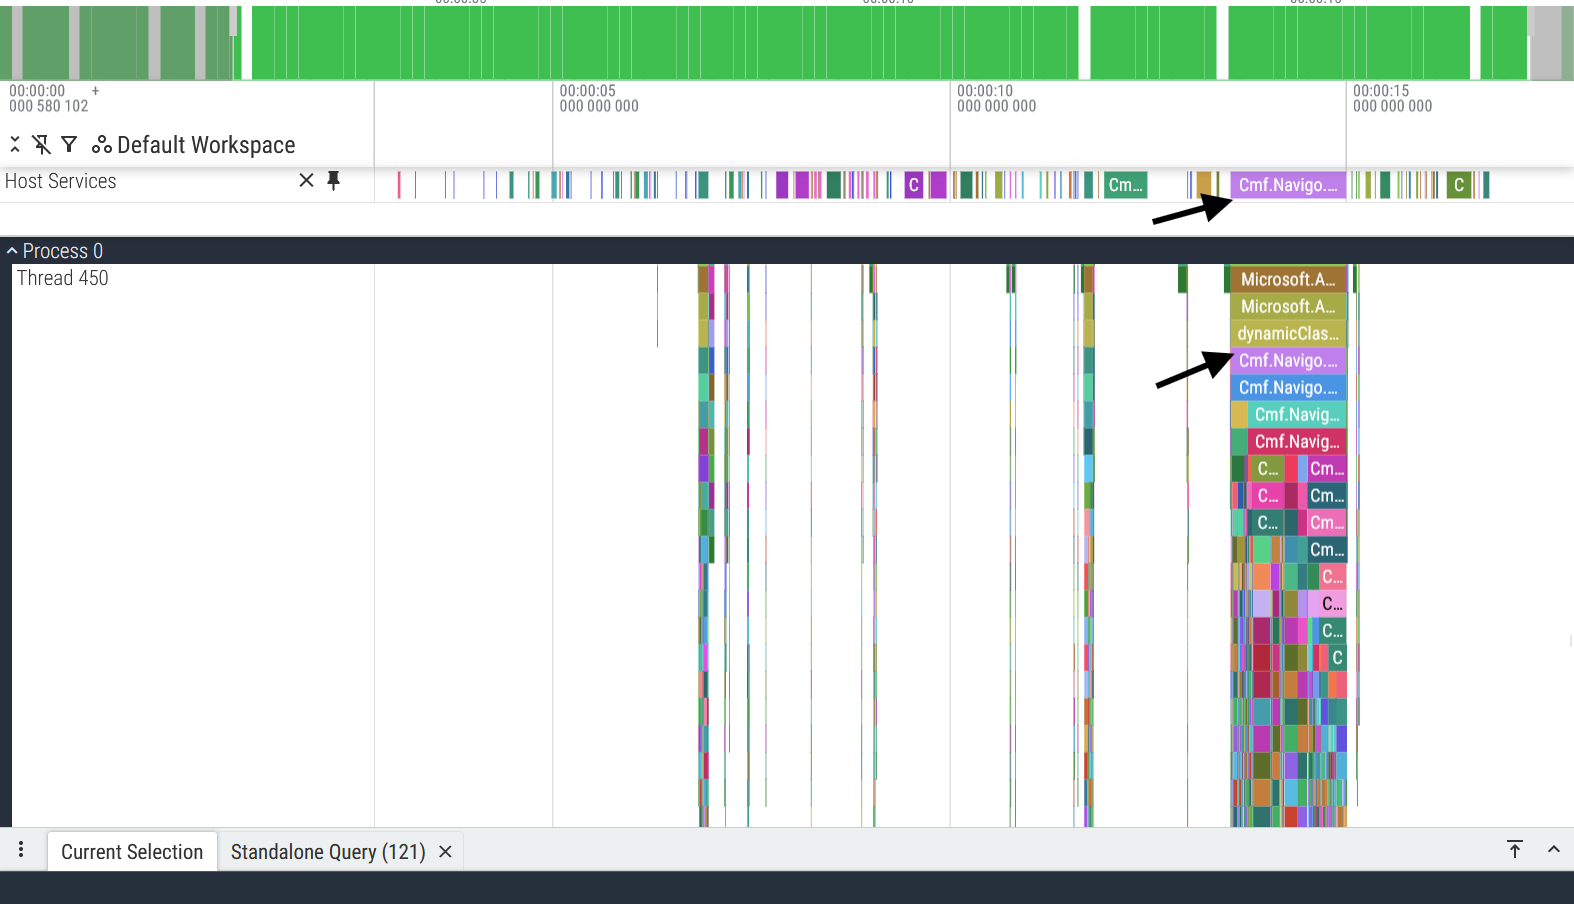
And there we go! What was previously information spread across multiple threads of execution, is now easily accessible through this debug track. And the cherry on top is that the slices on the debug track act as links to their “real” counterparts: for example, by selecting the purple span in the “Host Services” debug track (see image above) you can reach its counterpart on Thread 450.
Pushing debug tracks to the limit Link to heading
As you will have realized, debug tracks are an incredibly powerful visualization tool: it gives you the power to shape traces to your will. Take for example this query:
select * from slices where name glob 'Cmf.*';
It looks simplistic at first glance, but watch what happens when we create a debug track out of it:
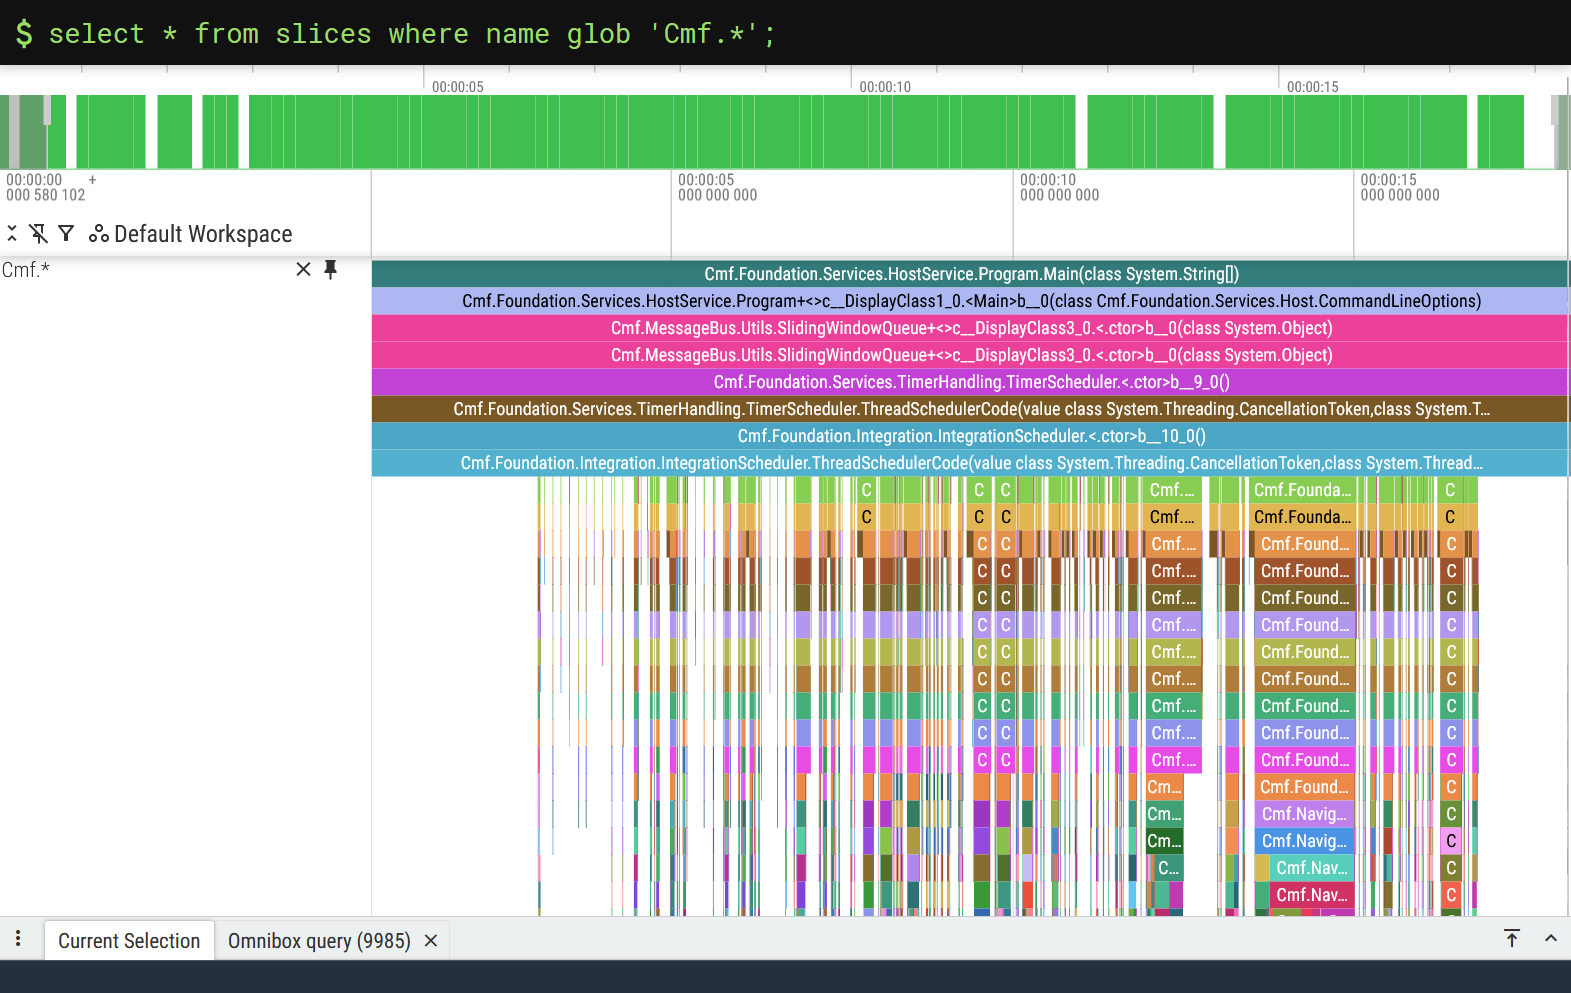
Just like that, we get all the business logic in a single track! Yes, this visualization is admittedly a bit rough around the edges, but it is amazing how much you get out of such a simple query.
And it goes without saying, the more effort you put into your SQL query, the better your debug track will be. This little tweak, for example, will filter out most of the middleware slices:
select * from slices where name glob 'Cmf.*' and depth > 50;
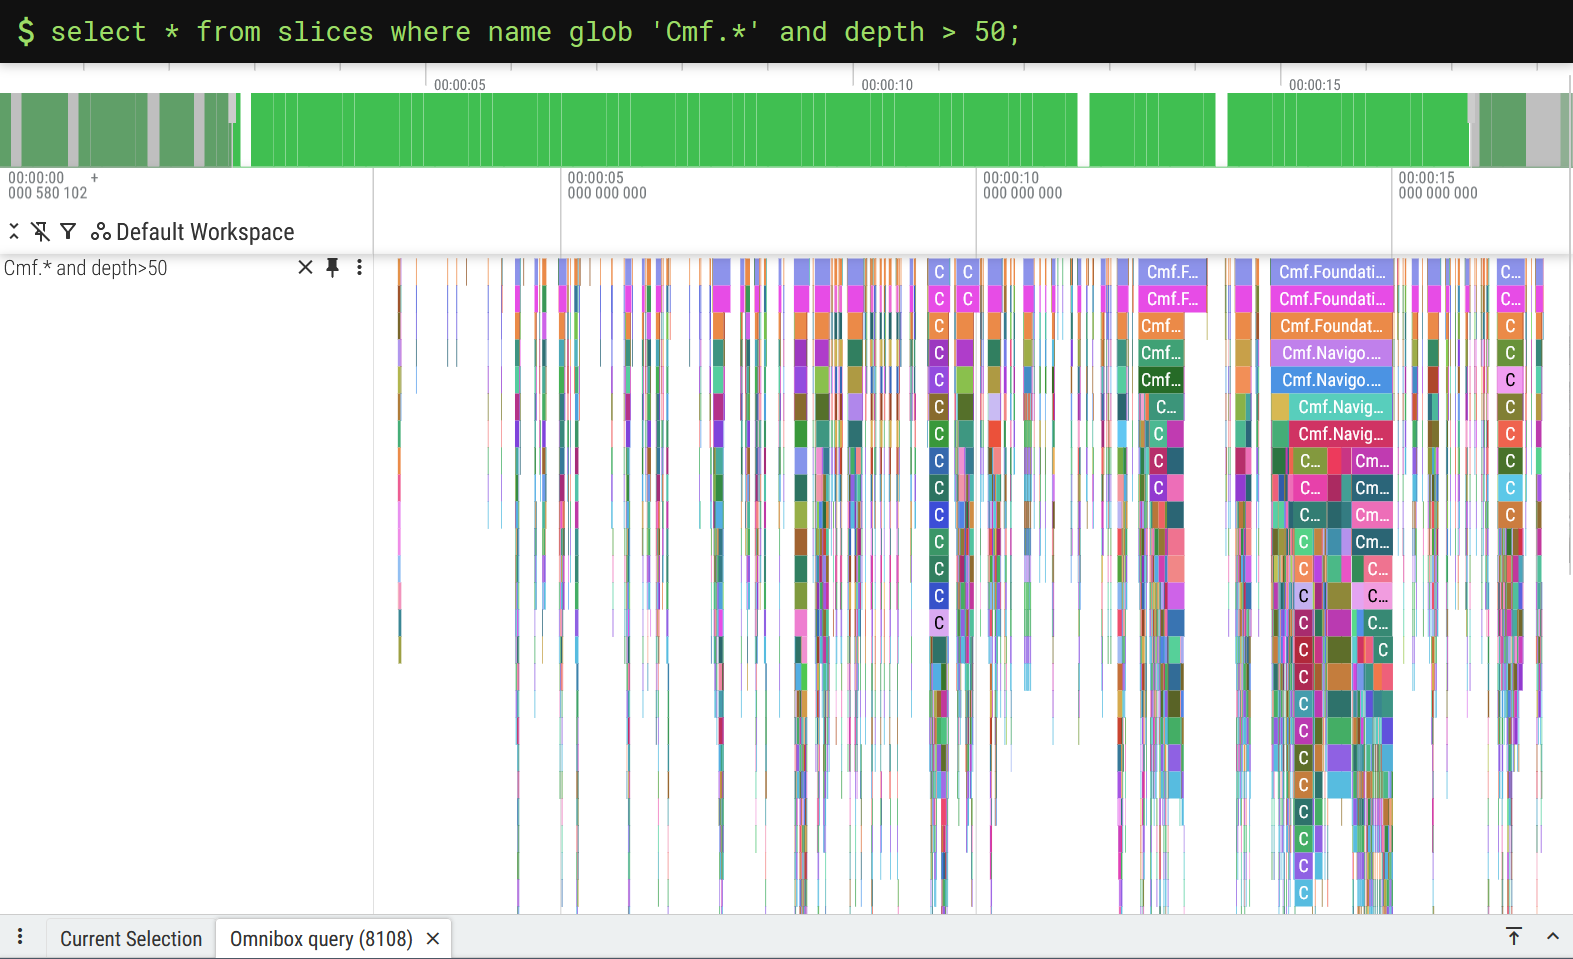
While this kind of works, it’s a crude approach to a problem that requires more finesse. We must ask ourselves first: what would a perfect debug track look like?
For me, the answer is obvious:
I want a debug track where the service slices sit at the base of the debug track, and all of the business logic of these services is included.
Striving for perfection Link to heading
Conceptually speaking, the recipe for this “perfect trace” is easy to explain:
-
Take the slices from this query
select * from slices where name glob 'Cmf.*'; -
And only keep the slices that are descendants of one of the slices from this query
select * from slices where name glob 'Cmf*.Services.*Controller.*';
Turning concepts into reality with SQL can sometimes be tricky, but today we are in luck: this can be done with a simple join statement and Perfetto’s slice_is_ancestor() utility function5.
select *
from
    (select id as service_id, track_id as service_track_id from slices where name glob 'Cmf*.Services.*Controller.*')
    join
    (select * from slices where name glob 'Cmf.*')
    on track_id=service_track_id -- Query optimization
where slice_is_ancestor(service_id, id) or service_id = id;
We can be proud of what was accomplished here: we’ve gone from having our services spread across multiple threads and buried under a ton of middleware, to now having those same services and their business logic located on a single debug track, ready to be analysed with ease.
Hunting for performance issues Link to heading
Now that the hard work of creating a good debug track is done, we can finally achieve the original goal of this blog post: finding performance issues in our .NET application. As my host application is heavily I/O bound by database calls, the performance issues I’m hunting are related to inefficient database access patterns - think multiple small loads instead of one big batch load.
These inefficient DB accesses can be easily spotted in the debug track by looking for visual repetitions. Here are a couple of examples of such patterns:
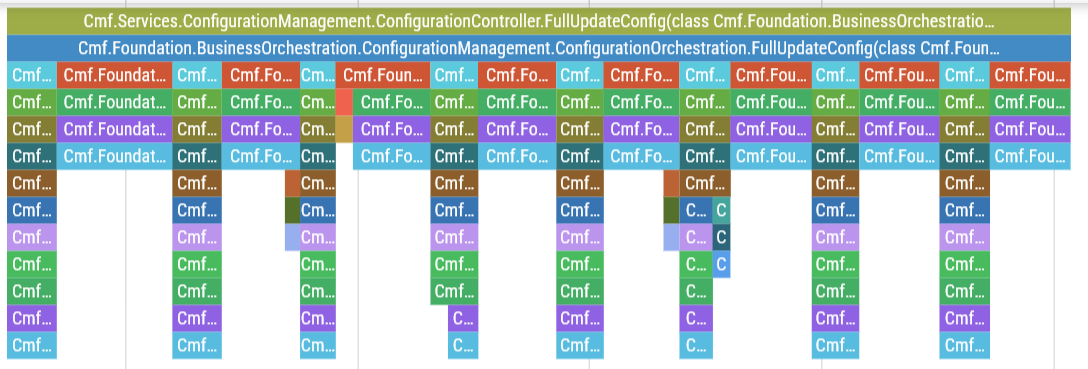
ConfigurationController.FullUpdateConfig is validating and saving the input configs one by one in some sort of for-loop.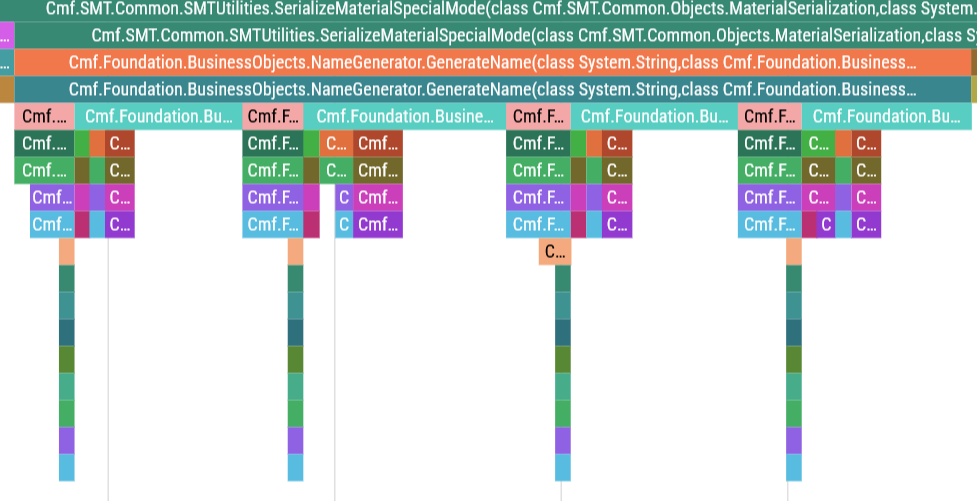
NameGenerator.GenerateName is calling INameGeneratorCollection.InternalLoad and NameGenerator.InternalGenerateName for every name that is generated.
In both these cases, the number of database accesses is scaling linearly with the size of the input, which is very much something we wish to avoid if possible.
Onwards and upwards Link to heading
Once you’re done analysing your trace file, you should have a list of performance issues to tackle. My job here is done, but yours has just begun: good luck with addressing the performance issues of your code, I’m rooting for you!
I hope this blog post gave you enough motivation to start collecting traces on your .NET application. It’s one thing to understand how your code is supposed to behave; it’s another to get empirical evidence of what is actually going on at the .NET runtime level - that’s the level of insight that dotnet-trace gives you.
I’d like to conclude this guide by giving some pointers to ways these trace files could be enhanced. The first thing you should be aware of is how the trace files generated by dotnet-trace can be enhanced by selecting additional event providers, of which I would suggest taking a close look at Microsoft.Data.SqlClient.EventSource: I’m certain that having the SQL queries directly embedded in the traces would help immensely while chasing performance issues. You might also consider directly editing the trace file to make some tweaks to existing slices, or even add completely new tracks! The sky really is the limit when it comes to these things.
-
The big exception here is if you’re using sidecar containers to run
dotnet-trace, in which case you probably know what you’re doing and should consider jumping straight to the Perfetto section of the blog post. ↩︎ ↩︎ -
The name of my container is
custom_host- replace it with your container’s name whenever you see it. ↩︎ -
I personally know that
custom_hostwill copy everything underLocalEnvironment\BusinessTier, so I just throw mydotnet-traceexecutable in there and it works like a charm! ↩︎ -
A Manufacturing Execution System is a software system responsible for the bookkeeping of a factory’s production. It is generally used in highly sophisticated industries, such as the semiconductor industry and the medical devices industry, where a high level of material tracking and control is required. ↩︎
-
Please note that while writing this blog post I found an issue with
slice_is_ancestor()which you also might encounter when using this function. My PR with the bugfix has already been merged, but it will take a while for the fix to reach the stable version of Perfetto. ↩︎