I’ve had enough of workarounds for dotnet-trace’s limit of 100 stack frames.
Just to recap from my previous misadventures, if you attach dotnet-trace to your application and your application has, for example, a call stack 120 calls deep, the “root” 20 stack frames get cut from the call stack that dotnet-trace receives, and you end up with completely unusable traces like these:
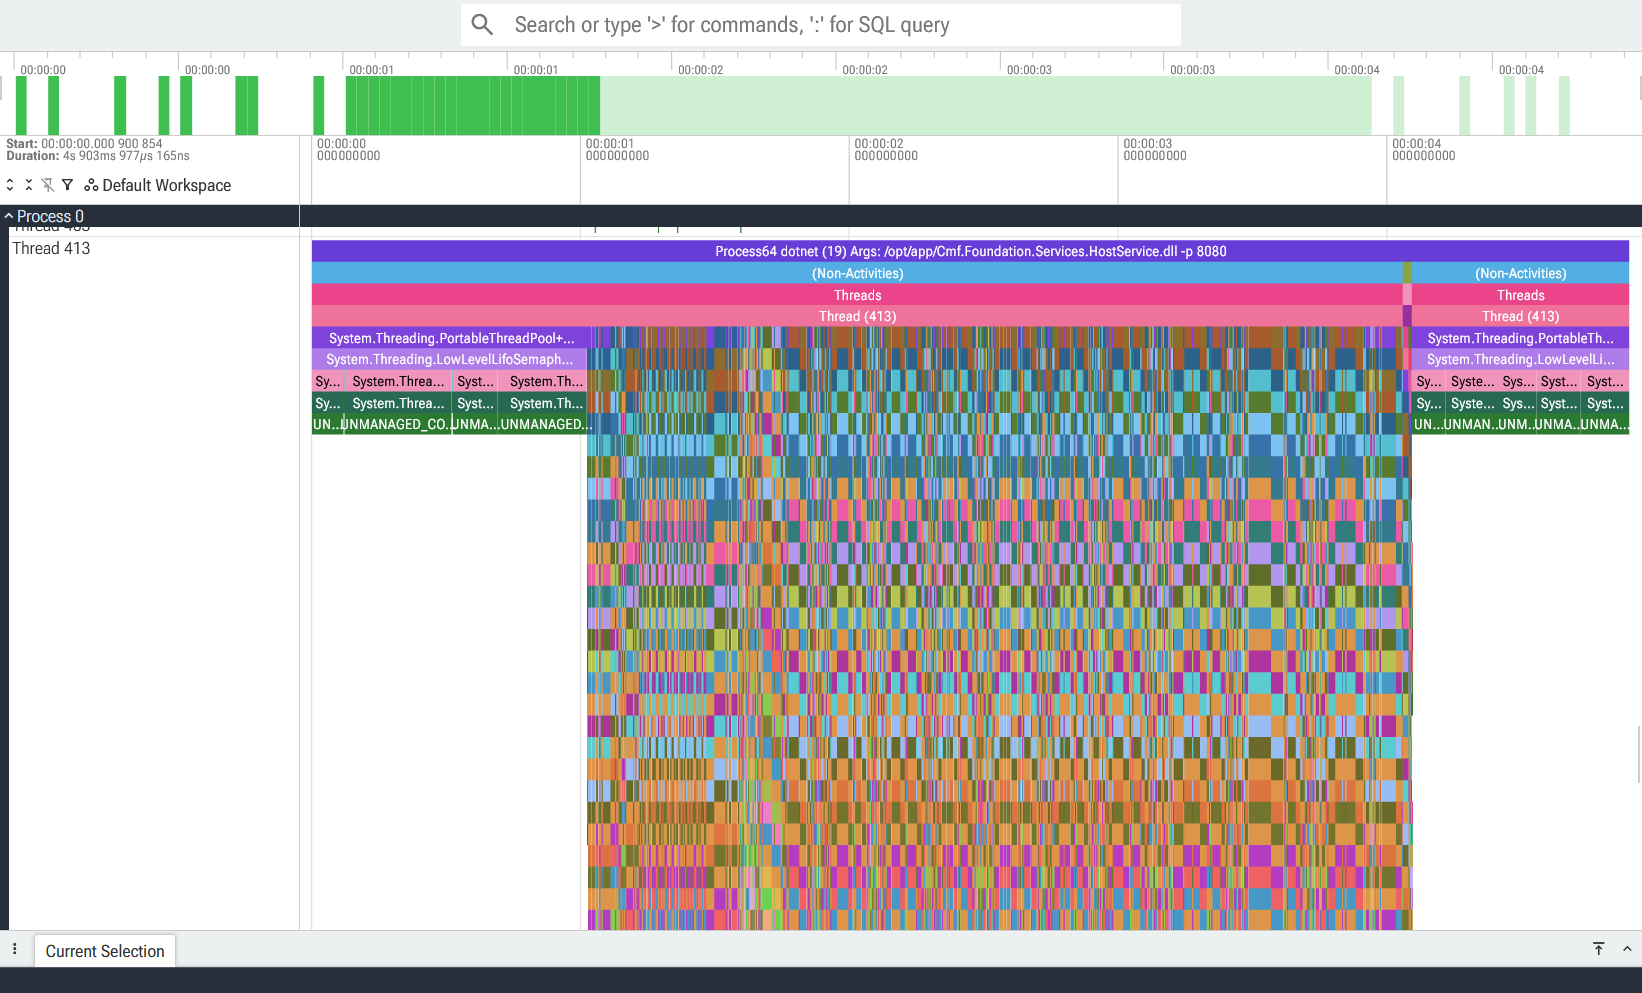
This isn’t any random trace: it comes from me guiding a work colleague through using dotnet-trace, and the grand result is this abominable rectangle that looks more like a spectrogram than an actual trace visualization!
I was a bit disheartened after this experience: I can write all the guides in the world about how to use dotnet-trace, but if a person’s first experience with using dotnet-trace results in this, then it will all be for naught.
We have to fix this at the source Link to heading
You can’t fix this in post. I know this because I tried that approach before, and the conclusion I reached was that asking the user to do any post-processing step will just discourage them from using this tool. This leaves us with only one final option: fixing dotnet-trace itself.
Thankfully, this is easier than it may appear at first glance: the one method you need to modify is this static Convert method one under src/Tools/dotnet-trace/TraceFileFormatConverter.cs:
private static void Convert(TraceFileFormat format, string fileToConvert, string outputFilename, bool continueOnError = false)
{
    string etlxFilePath = TraceLog.CreateFromEventPipeDataFile(fileToConvert, null, new TraceLogOptions() { ContinueOnError = continueOnError });
    using (SymbolReader symbolReader = new(TextWriter.Null) { SymbolPath = SymbolPath.MicrosoftSymbolServerPath })
    using (TraceLog eventLog = new(etlxFilePath))
    {
        MutableTraceEventStackSource stackSource = new(eventLog)
        {
            OnlyManagedCodeStacks = true // EventPipe currently only has managed code stacks.
        };

        SampleProfilerThreadTimeComputer computer = new(eventLog, symbolReader)
        {
            IncludeEventSourceEvents = false // SpeedScope handles only CPU samples, events are not supported
        };
        computer.GenerateThreadTimeStacks(stackSource);

        switch (format)
        {
            case TraceFileFormat.Speedscope:
                SpeedScopeStackSourceWriter.WriteStackViewAsJson(stackSource, outputFilename);
                break;
            case TraceFileFormat.Chromium:
                ChromiumStackSourceWriter.WriteStackViewAsJson(stackSource, outputFilename, compress: false);
                break;
            default:
                // we should never get here
                throw new DiagnosticToolException($"Invalid TraceFileFormat \"{format}\"");
        }
    }

    if (File.Exists(etlxFilePath))
    {
        File.Delete(etlxFilePath);
    }
}
dotnet-trace implements the conversion to the speedscope and chromium formats by essentially delegating that responsibility to the perfview project. We will replace the contents of this method and implement this conversion ourselves in this blog post.
This will be done in classic ETL fashion: Extract, Transform and Load.
Extract Link to heading
In this initial step we extract all the relevant data into a mapping of threads to lists of trace samples. This will be the main data structure we will be operating on.
private static void Convert(TraceFileFormat format, string fileToConvert, string outputFilename, bool continueOnError = false)
{
    string etlxFilePath = TraceLog.CreateFromEventPipeDataFile(fileToConvert, null, new TraceLogOptions() { ContinueOnError = continueOnError });

    // Retrieve the call stacks from the file
    // threadId -> List of (timestamp, frames)
    Dictionary<int, List<CallstackSample>> callStacks = GetCallstacks(etlxFilePath);

    if (File.Exists(etlxFilePath))
    {
        File.Delete(etlxFilePath);
    }
}

/// <summary
/// Represents a singular call stack from a thread, sampled at a given TimestampMs.
/// </summary>
public record CallstackSample(double TimestampMs, List<string> StackTrace);
Transform Link to heading
Now it’s time to put our surgeon’s gloves on and start manipulating our call stacks. If a potentially truncated call stack is detected, the following is done:
- Compare the base stack frame against all the stack frames of the previous sample. The idea is that while call
abc()might be the root frame of our truncated call stack, it might in reality be frame #10 and the actual first 10 frames were suppressed. - Compare the matches and select the one that better aligns with the previous call stack - the candidate with the most overlap wins.
- Insert the missing stack frames - the call stack should be correct now.
I recognize it might be difficult to understand the algorithm just from this synopsis, so I cooked up a visualization just for you:
FixCallStacks algorithm.And here’s the corresponding code:
/// <summary>
/// Fixes the call stacks truncated by the EventPipe's 100 stack frame limit.
/// </summary>
public static void FixCallStacks(Dictionary<int, List<CallstackSample>> threadMap)
{
    foreach ((int threadId, var samples) in threadMap)
    {
        for (int sampleIndex = 1; sampleIndex < samples.Count; sampleIndex++)
        {
            var previous = samples[sampleIndex - 1];
            var current = samples[sampleIndex];

            if (current.StackTrace.Count < 100)
            {
                // We aren't exceeding the stack frame limit here,
                // therefore we don't need to fix anything.
                continue;
            }

            if (previous.StackTrace[0] != current.StackTrace[0])
            {
                // Get list of stack traces from `previous` that matches the `current` base frame
                var candidates = new List<int>();
                for (int i = 0; i < previous.StackTrace.Count; i++)
                {
                    if (previous.StackTrace[i] == current.StackTrace[0])
                    {
                        candidates.Add(i);
                    }
                }

                if (candidates.Count == 0)
                {
                    // If there's no matching stack frame from `previous`,
                    // there's nothing we can do
                    continue;
                }

                // Select the best candidate match from the list of candidates.
                // The best candidate match is the one with the most call stack overlap
                // between `previous` and `current`
                (int Index, int Overlap) bestCandidate = (-1, -1);
                foreach (int candidateIndex in candidates)
                {
                    int overlap = 0;
                    while (previous.StackTrace[candidateIndex + overlap] == current.StackTrace[overlap])
                    {
                        // For as long as the stack frames keep matching, keep increasing the overlap
                        overlap++;

                        if (candidateIndex + overlap == previous.StackTrace.Count || overlap == current.StackTrace.Count)
                        {
                            // We have an index out of bounds, so we have to stop
                            break;
                        }
                    }

                    if (overlap > bestCandidate.Overlap)
                    {
                        bestCandidate = (candidateIndex, overlap);
                    }
                }

                // Insert the missing stack frames
                for (int prevIndex = 0; prevIndex < bestCandidate.Index; prevIndex++)
                {
                    current.StackTrace.Insert(prevIndex, previous.StackTrace[prevIndex]);
                }
            }
        }
    }
}
Load Link to heading
The final step is to convert our callStacks data structure into our preferred trace format. The code behind this serialization is not that interesting, so I decided to outsource the implementation of SpeedscopeWriter and ChromiumWriter to Gemini.
This is the final state of the Convert method:
private static void Convert(TraceFileFormat format, string fileToConvert, string outputFilename, bool continueOnError = false)
{
    string etlxFilePath = TraceLog.CreateFromEventPipeDataFile(fileToConvert, null, new TraceLogOptions() { ContinueOnError = continueOnError });

    // Retrieve the call stacks from the file
    Dictionary<int, List<CallstackSample>> callStacks = GetCallstacks(etlxFilePath);

    // Fix the callstacks
    FixCallStacks(callStacks);

    if (File.Exists(etlxFilePath))
    {
        File.Delete(etlxFilePath);
    }

    switch (format)
    {
        case TraceFileFormat.Speedscope:
            SpeedscopeWriter.Convert(outputFilename, callStacks);
            break;
        case TraceFileFormat.Chromium:
            ChromiumWriter.Convert(outputFilename, callStacks);
            break;
        default:
            // we should never get here
            throw new Exception($"Invalid TraceFileFormat \"{format}\"");
    }
}
So… does it work? Link to heading
After all this work, have we done it? Let’s start with a simple test: a broken trace from this github issue, which happens to be one of the first mentions of this limitation that I discovered:
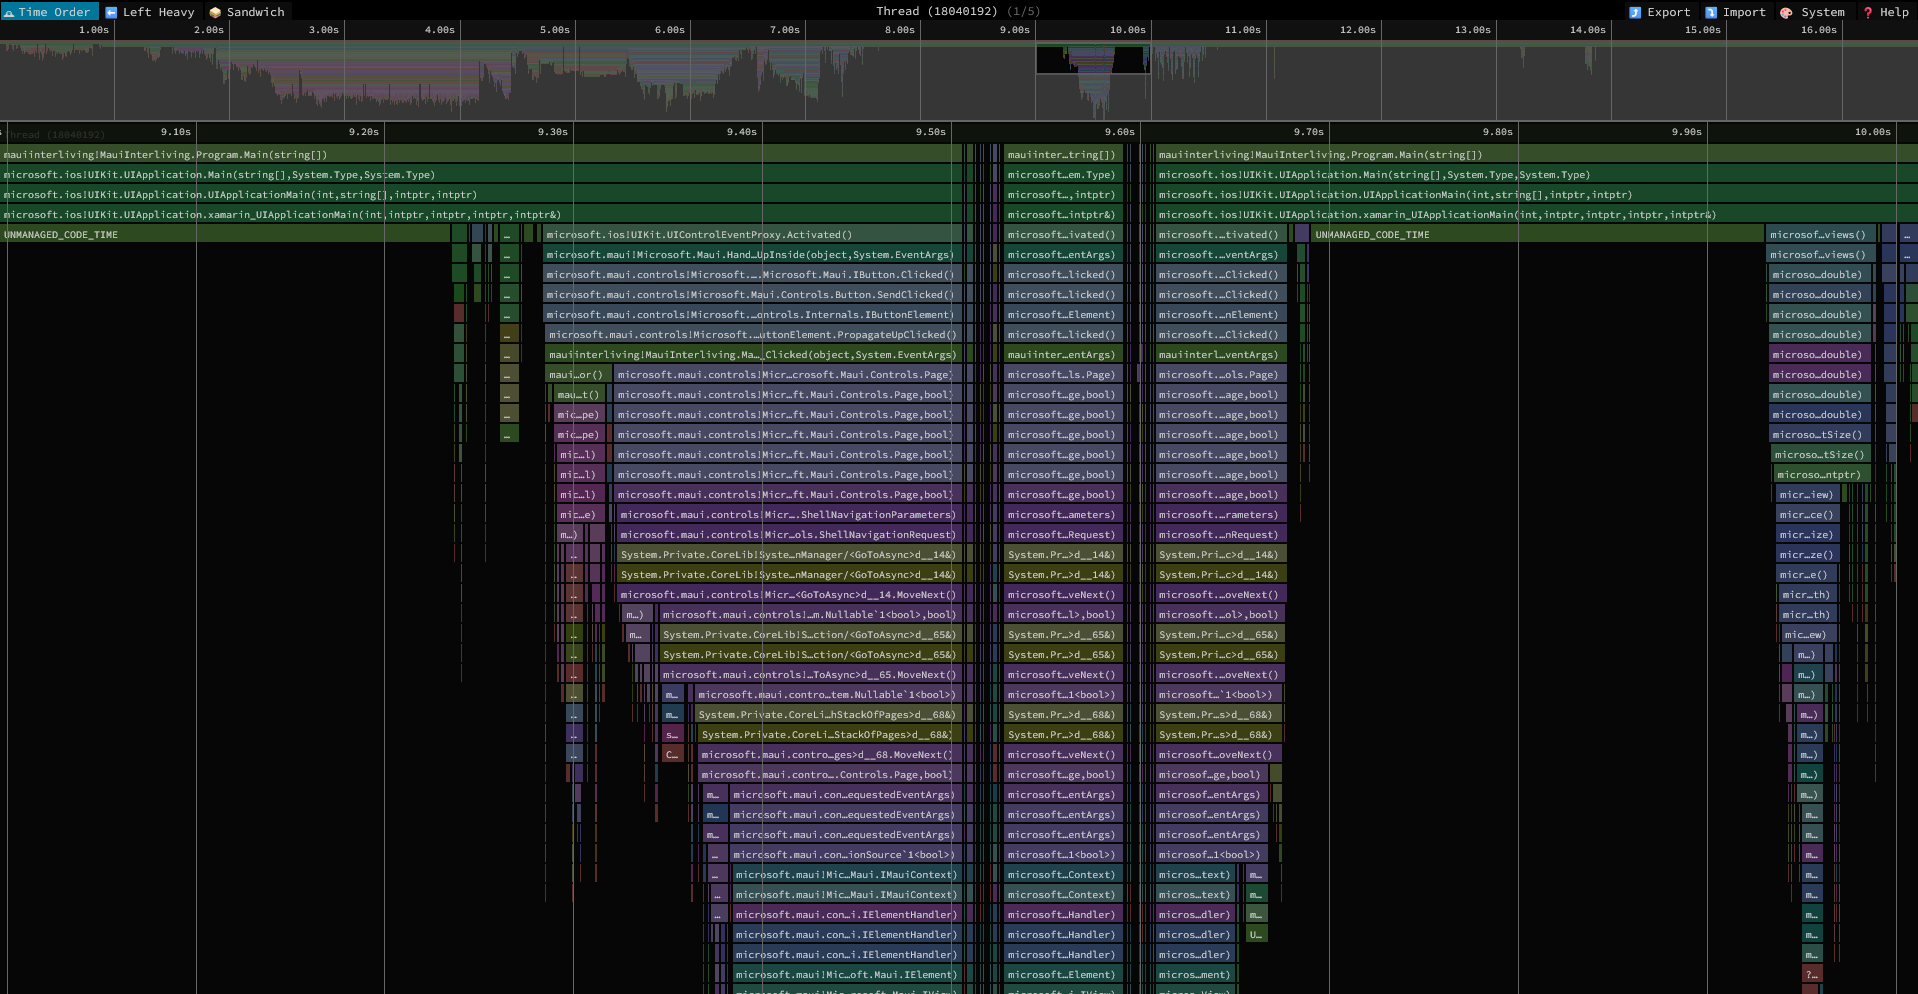
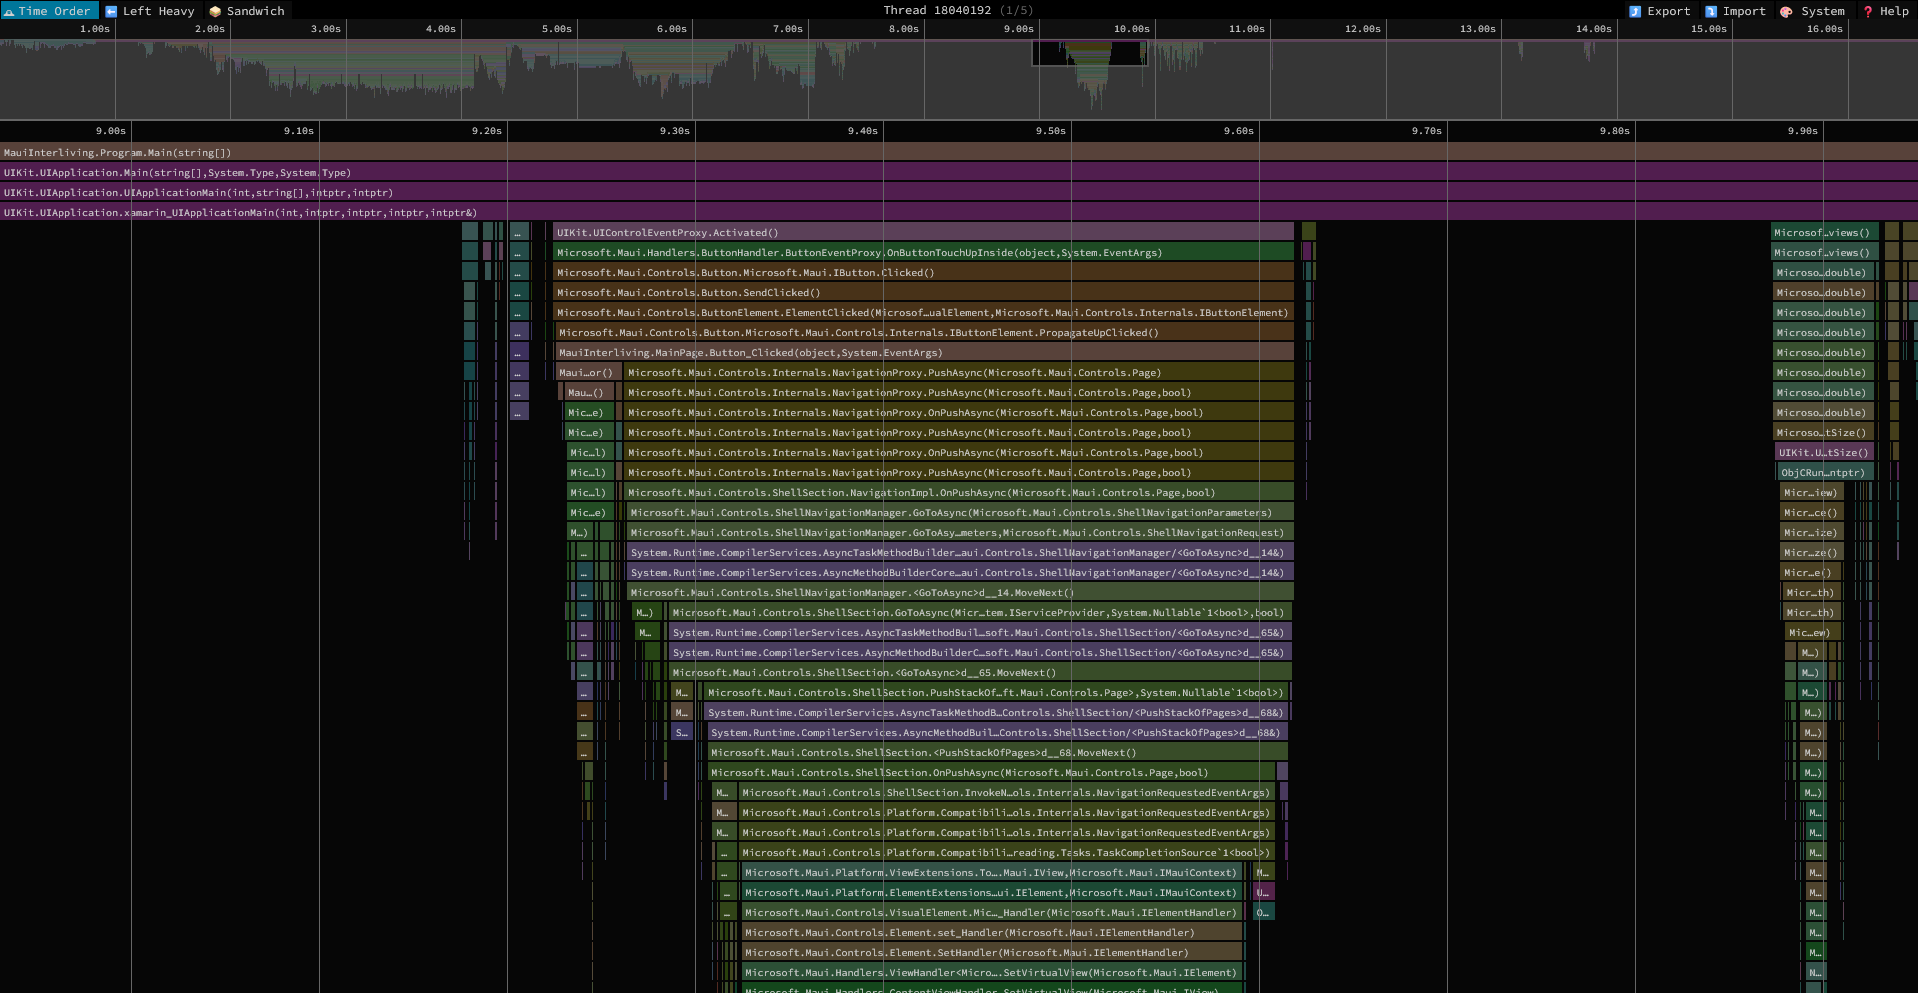
So far so good! But this trace is child’s play compared to some traces I’ve collected at Critical Manufacturing, where the host of the system can compile C# code on-demand while serving a request1! This is a call stack that can easily go 200-300 frames deep, and is definitely the ultimate challenge for the adjustments we made to dotnet-trace in this blog post.
So… does it really work? Link to heading
Let’s run our tweaked Convert method against a trace from a Critical Manufacturing MES host and see what happens:
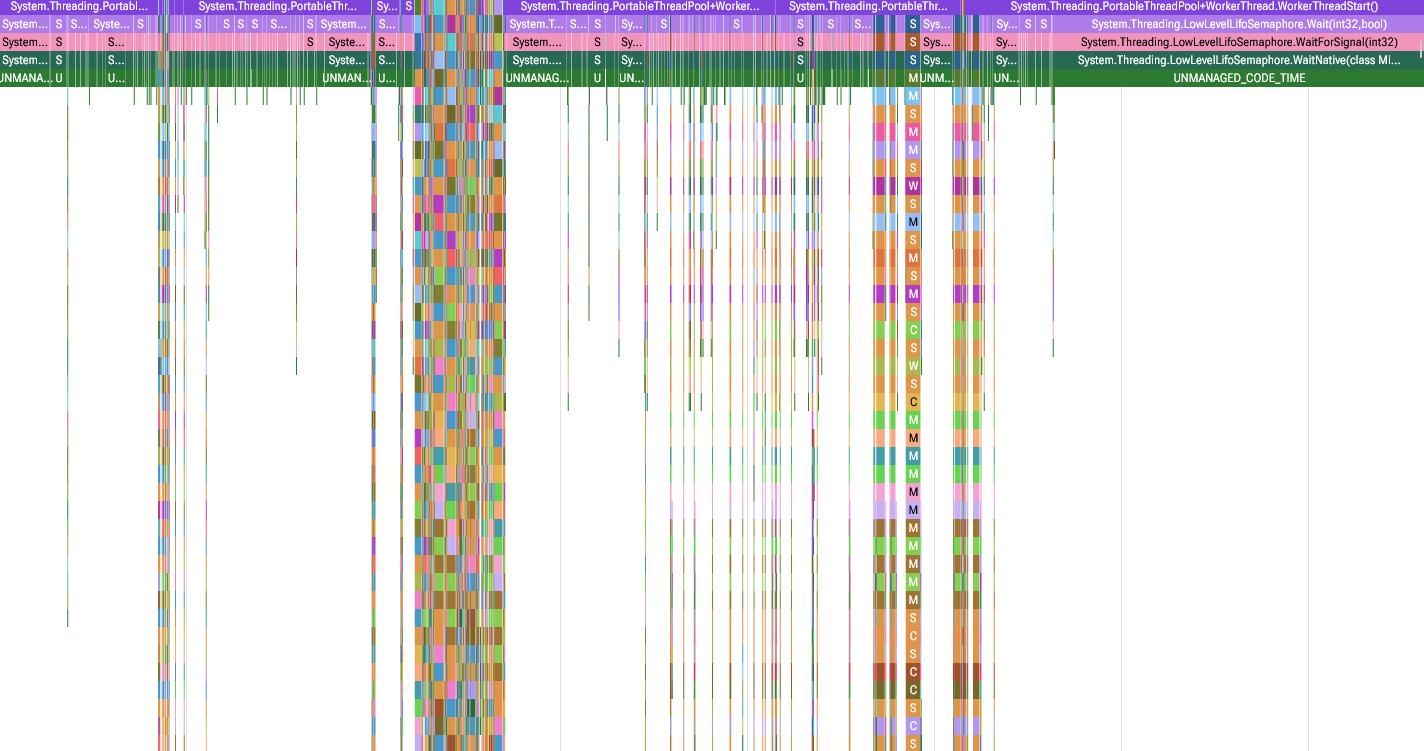
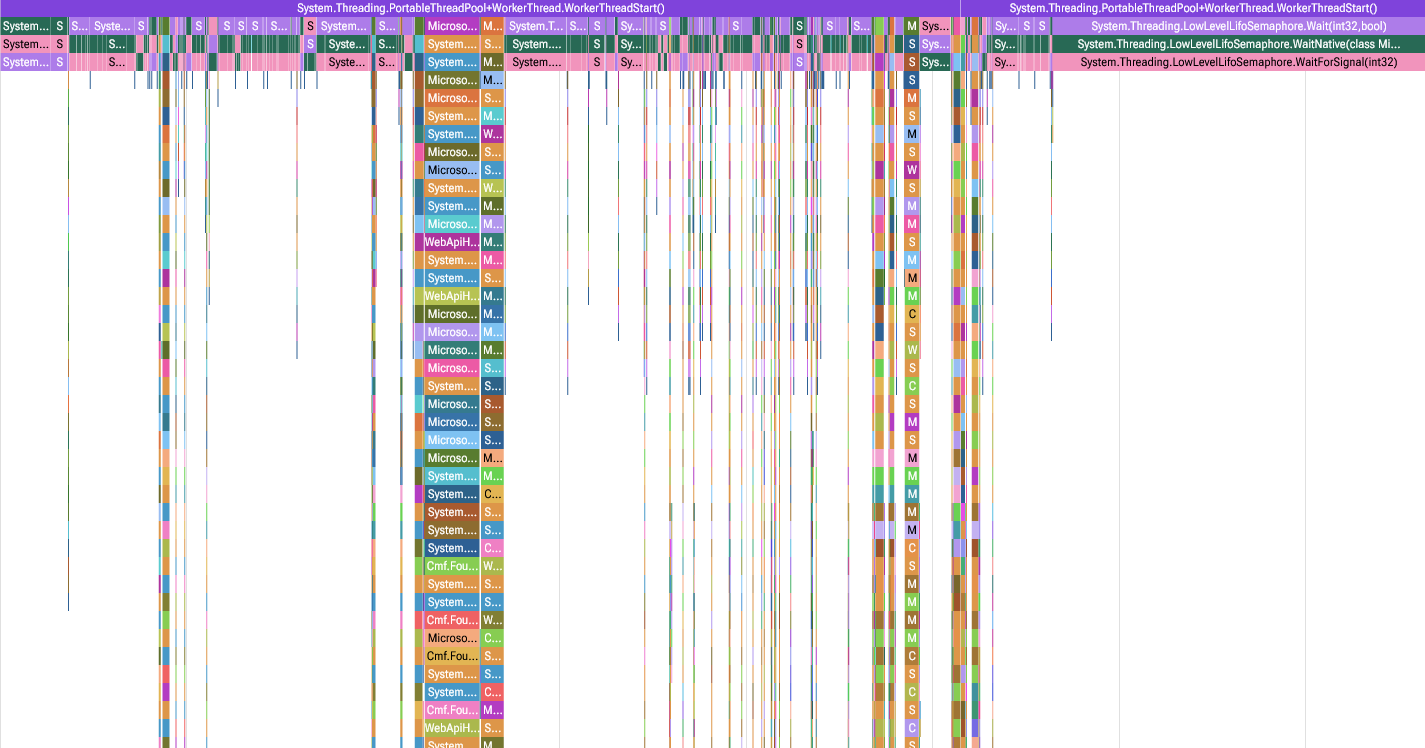
The quality of the trace has improved significantly, but we’re not there yet. If we zoom in, we can still find disruptions:
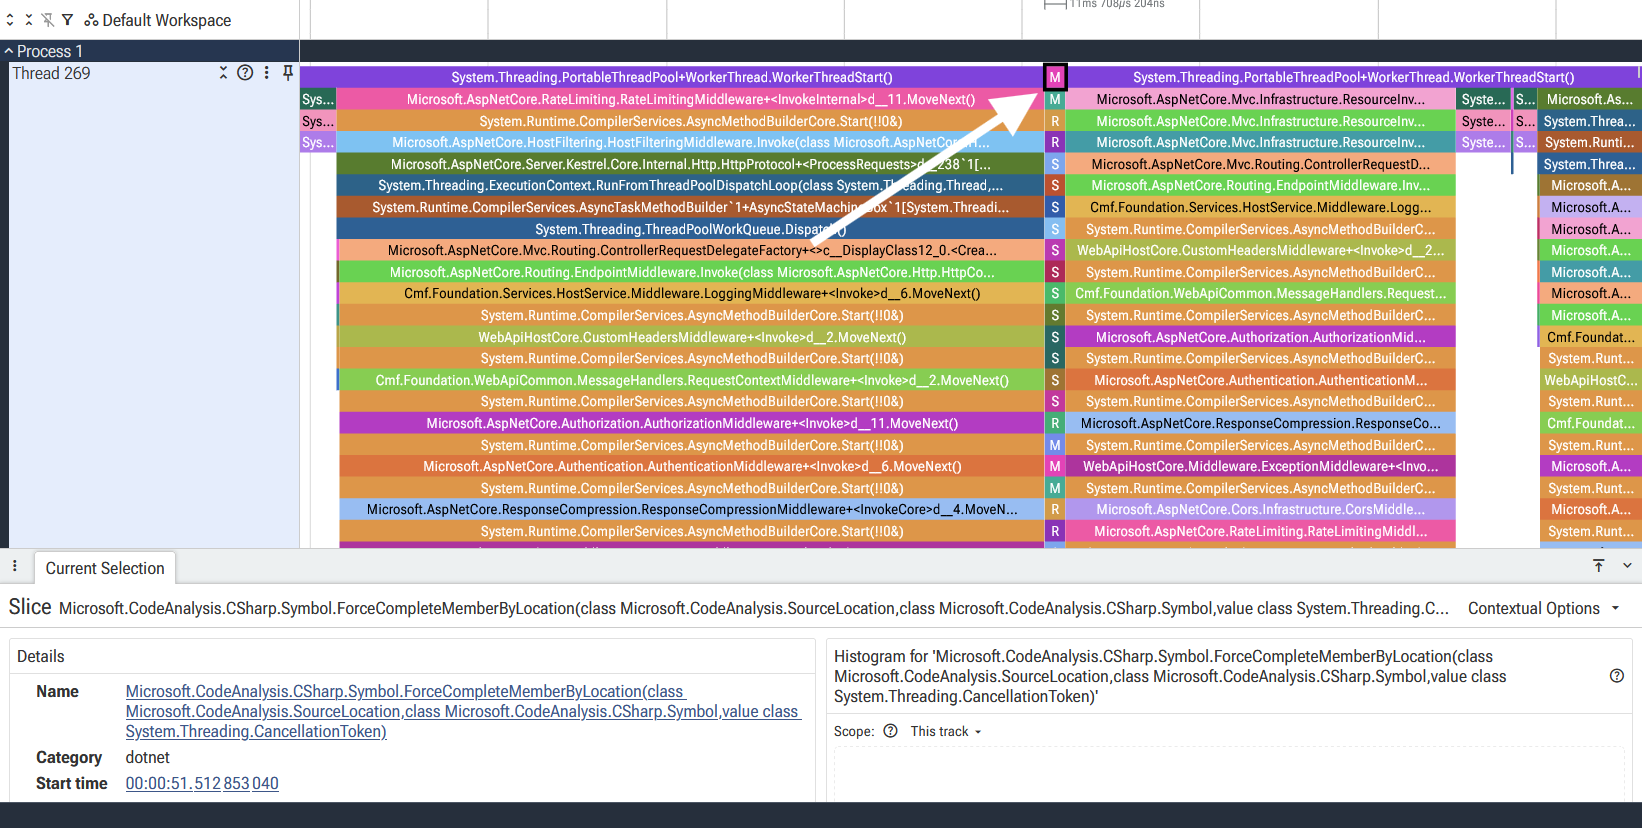
This is happening because the ForceCompleteMemberByLocation function call can not be found in the previous trace, and therefore we hit this code path in FixCallStacks:
if (candidates.Count == 0) // <==== No matches! ====
{
    // If there's no matching stack frame from `previous`,
    // there's nothing we can do
    continue;
}
I honestly thought this if (candidates.Count == 0) edge case would never be triggered. I mean, who on earth goes 100 function calls deep within a single millisecond?! The Roslyn compiler apparently.
I have an idea on how to fix this, but it’s not pretty.
The observability gods demand a blood sacrifice Link to heading
I’m going to do something truly sacrilegious… I’m going to just delete the samples that can’t be rescued:
if (candidates.Count == 0)
{
    // If there's no matching stack frame from `previous`, delete this sample.
    samples.RemoveAt(sampleIndex);
    sampleIndex--;
    continue;
}
Yes, I know, pure heresy. But you can’t argue against results:
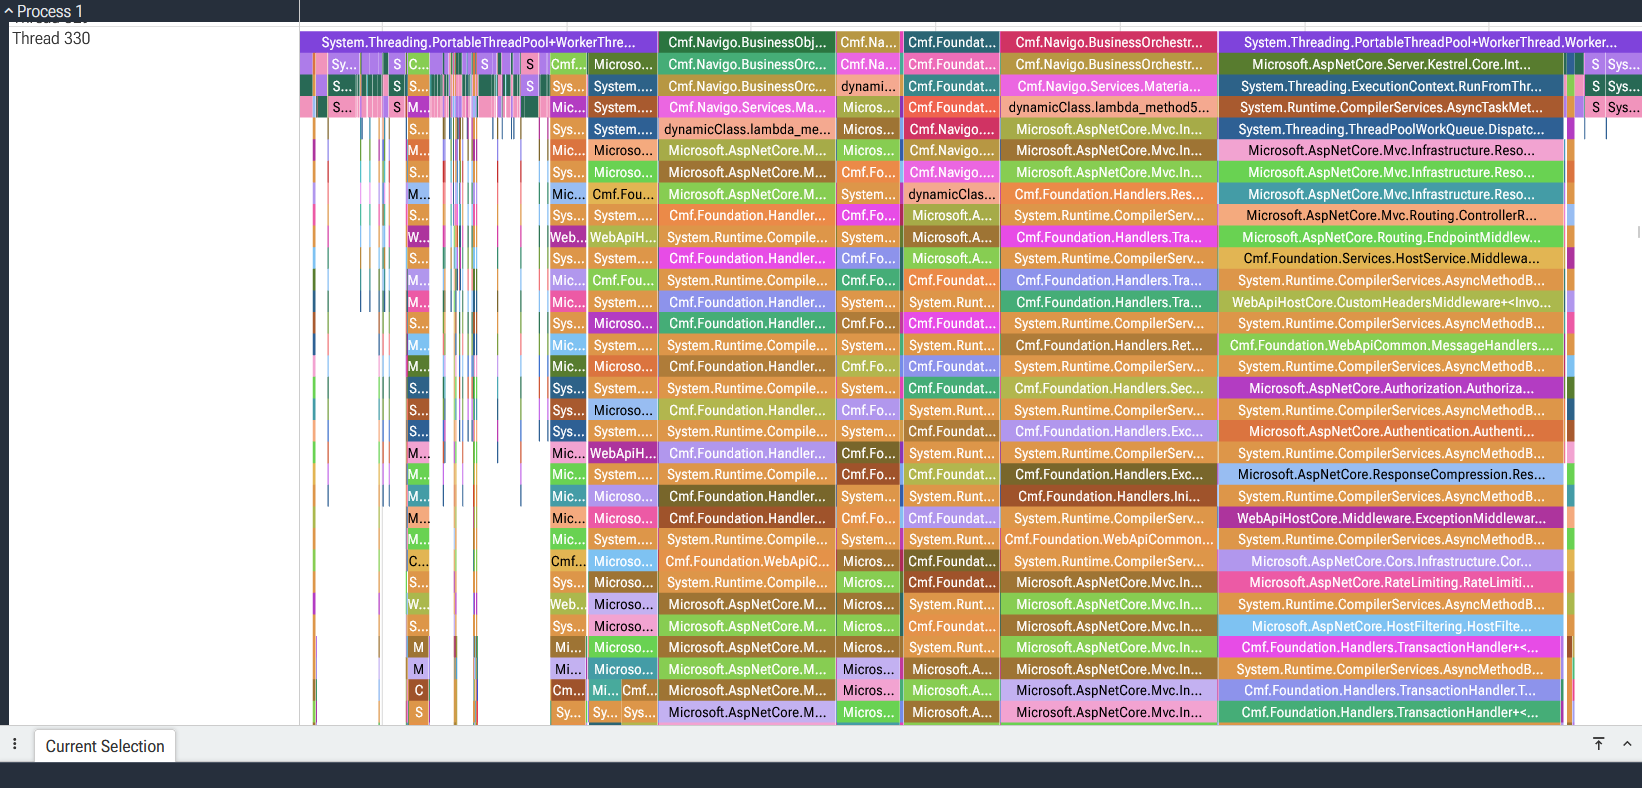
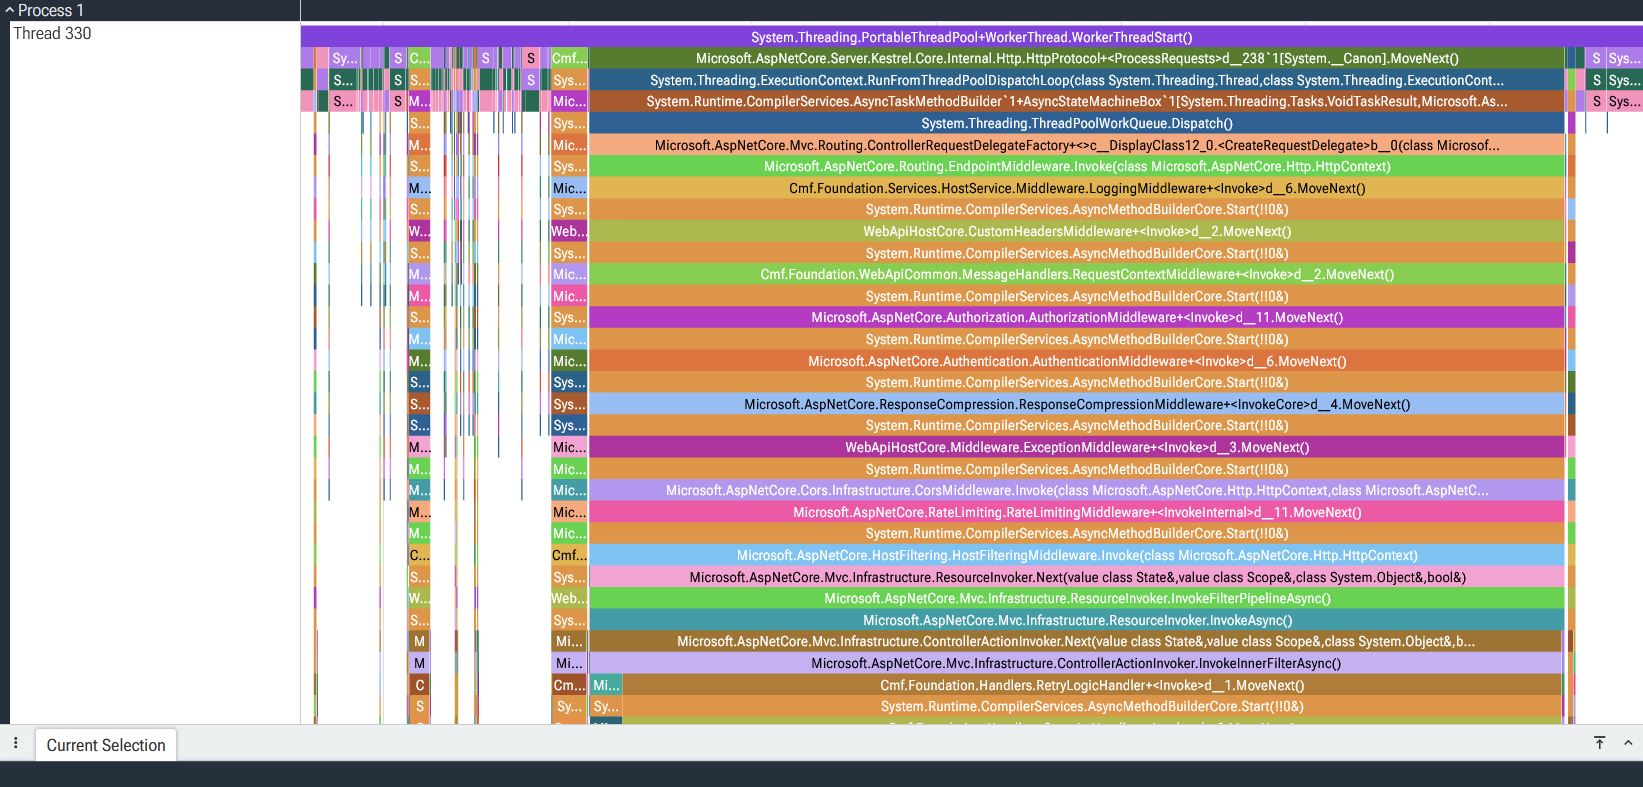
And what is the price to pay for these perfect traces? 69 samples out of 2194244, or 0.003%. I’ll take that deal any day of the week.
Putting everything together Link to heading
The only task remaining is going through the bureaucracy of forking dotnet/diagnostics, introducing our changes, and compiling our very own customized dotnet-trace.
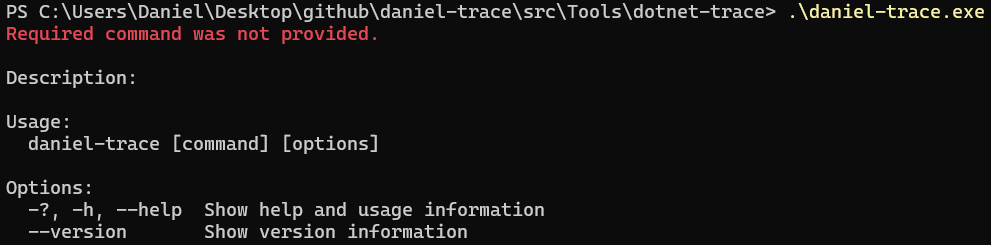
In order to be able to distinguish between the canonical dotnet-trace and my own version, I renamed my own version of this tool to daniel-trace… I couldn’t come up with a better name, sorry.
Give it a go! Link to heading
You can install daniel-trace by downloading the relevant executable:
If you are running another architecture (Arm, etc.) it should be easy enough to compile the project yourself - here’s the link to my fork of the dotnet/diagnostics repository.
Usage Link to heading
daniel-trace is a drop-in replacement of dotnet-trace - just change the name and you should be good to go:
PS C:\Users\Daniel\Desktop\github\blog\dotnet-trace-final-fix> .\daniel-trace.exe convert .\dotnet_20260727_184408.nettrace --format Chromium
Processing trace data file 'C:\Users\Daniel\Desktop\github\blog\dotnet-trace-final-fix\dotnet_20260727_184408.nettrace' to create a new Chromium file 'C:\Users\Daniel\Desktop\github\blog\dotnet-trace-final-fix\dotnet_20260727_184408.chromium.json'.
69 samples out of 2195227 could not be recovered and have been deleted (0.003%)
    Thread 269 (7): 51.514s-51.524s
    Thread 313 (1): 12.130s
    Thread 330 (45): 17.697s-17.705s, 72.990s-72.999s, 74.921s-74.932s, 75.620s-75.661s, 76.705s-76.712s, 79.055s-79.057s
    Thread 363 (16): 58.786s, 60.525s-60.546s, 60.992s-60.999s
Conversion complete
PS C:\Users\Daniel\Desktop\github\blog\dotnet-trace-final-fix>
Have fun analysing traces!
Oh, and one more thing…2 Link to heading
Besides the improvements mentioned earlier in this blog post, I also took the opportunity to add a couple of optional flags to the collect and convert commands:
--first-span: Remove spans from the call stack starting from the root until a span that matches the filter is found. Supports unix-style wildcards.--span-filter: Remove spans from the call stack that don’t match the filter. Supports unix-style wildcards.
With these two optional arguments, you can perform very fine-grained filtering directly with daniel-trace instead of having to do it in the Perfetto trace viewer.
A quick example Link to heading
To collect and filter traces from the Critical Manufacturing host, you would run something similar to this command:
daniel-trace collect -p 123 --format Chromium --first-span "Cmf*.Services.*Controller.*" --span-filter "Cmf*"
And you’d get the following trace out of the box:
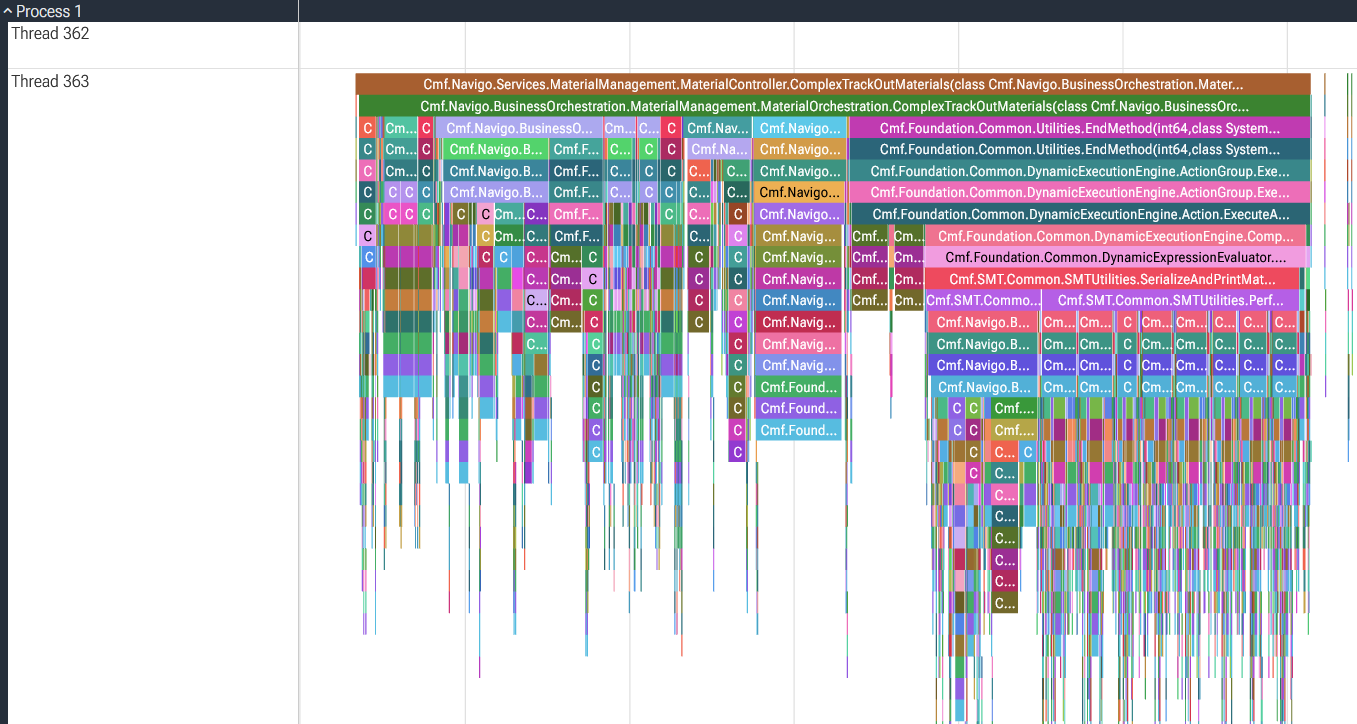
That’s about as good as it gets!
-
There are very good extensibility-related reasons for doing this - I will leave this link here for more info. ↩︎
-
Pretend I’m wearing a black turtleneck while you read this final chapter. ↩︎